
Just imagine if the performance of your website is being held back simply because your visitors are not seeing your best content. Forget about them choosing not to read it – they just don’t get to see it. And this is not just any content. It’s all that “must read” information like testimonials, reviews, videos.
How would that make you feel? Just a tad bothered?
What would cause this? Most often, it’s your visitors not bothering to scroll down the page to read what’s below the first screen.
Does your website rely on visitors scrolling? Perhaps it was set up with the assumption that because you scroll, so must everyone else.
Well, let’s check that assumption against this graph from an actual Google Analytics account.
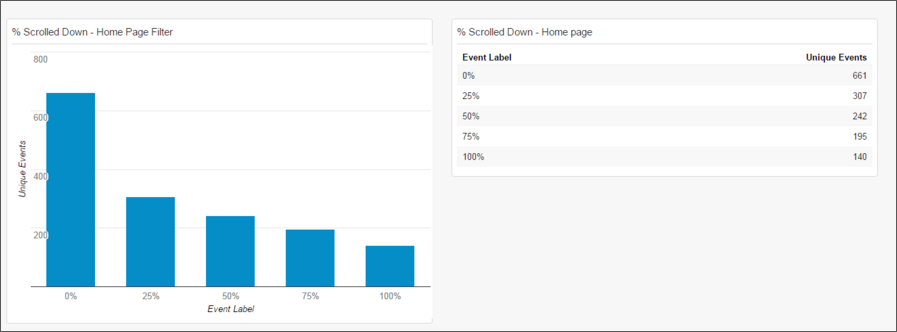
The graph shows scrolling behaviour for a website’s home page. The tall bar on the left represents everyone who arrived on the page. The next bar shows how many visitors scrolled down to see the top 25% of the page. Subsequent bars show how many visitors got 50%, 75% and 100% of the way down the page.
Let’s state the obvious here – the bars are different heights. Just because people can scroll doesn’t mean they do.
Now note the dramatic gap between the first two bars. Fewer than half of all visitors even start scrolling. One reason in this case was the layout of the page. It looked complete when you arrived. The design didn’t suggest there was more content below.
So most visitors, instead of scrolling, clicked the navigation bar to learn more. And they missed the great testimonials hidden just below the bottom of their screen.
Finally, note the relatively small gaps between bars two to five. This tells us that once people started scrolling, they continued down the page. That’s not always what happens. Sometimes there’s a dramatic drop off at about the halfway point, with few making it to the bottom.
Knowing what proportion of your visitors start to scroll, and how far they actually get, should guide you in where to place your content.
For instance, all the critical content – the “must read” stuff – should be as high as possible. It can be followed by the “good to read” stuff. Then, hovering around the bottom, put the “nice to read” content.
So far so good. Now to add a bit of spice – the scrolling behaviour of mobile visitors can be different from that of their desktop cousins.
The good news is that it’s quite easy to track the scrolling behaviour of all your visitors – desktop and mobile. Just allow us to edit your Google Analytics configuration and you’ll be set.
Once results are in you can re-order your content from top to bottom into the “ Must Read” and“ Nice to Read” groups, and possibly adjusting it for mobile visitors. In our experience, being aware of visitor scrolling behaviour, and re-ordering your content accordingly, can produce a nice upward bump in engagement.
Contact us today if you would like to learn more about this.