Google Analytics recently updated the way in which users could build segments. The screens got a tweak to make them easier to use and a fair dollop of extra parameters were added. This all sounds super geeky and of little use to most business owners, however because I’m writing about it here I can assure you that the opposite is really the case.
First up let’s get into what Segments are and why they need some attention. I’ll begin with a three stage levels of how people view the traffic their website receives.
Hits
This is a throwback to the old ways of tracking websites. Basically it’s a technical term that relates to the type of content that is downloaded from your website as people browse your pages. So a website designed a different way could have more hits than another but its traffic could be lower. Because of this inherent issue knowing your “hit count” is most probably less valuable than knowing nothing about your sites performance.
Visitors
Now we are making progress. This is a count of actual humans who are clicking on your pages. Visitors have page visits, returning visits and new visits. They are the closest thing we have to measure when it comes to tracking actual people. We can see where they came from -Google organic or paid advertising, directly to your site, or from you last email campaign. And we can see what pages they looked at.
However the illusion in all of this is that everyone is the same wanting the same problem solved the same way. A big bucket of sameness. Which thankfully isn’t correct as the world is made up of very different people wanting solutions to their own different type of problems. This is where Segments come in.
Segments
Segments allow you to carve up your visitors into logical groups. Once built, you can see how the groups perform on your website compared to other groups or the overall site average. The latest update gives you a bit more flexibility in how these groups are defined and more importantly lets you look at people, not just the visits they take.
For instance here are three groups that were not available before but are now.
1) Segments based on users not visits
So you run an e-commerce store and want to see how customers who have spent more than $100 over the last two months interacted with your website. Previously this was all done at a visit level.
Previously any customer who completed an order worth $100 or more during a single visit was added to the segment. Now you can define this segment at a user level which allows Google analytics to sum all the sales a user made during this period and if they were $100 or more, include them in the segment. As you can imagine, there’s quite a bit of difference between the two.
2) Segments based on users taking a series of actions
Let’s say your ideal user needs to visit your website and look at a landing page for a specific service and then to complete a contact us request form. They may do this over a series of sessions.
For instance, their first session has them arrive and look at the landing page, the next has them completing the form. Now with this update you can define a segment as those who complete both actions whether these were completed across one or multiple sessions.
Previously if they didn’t do both actions within the one visit they were not included.
3) You can create segments based on the date of the first visit of a user
This could be ideal for those addicted to offering daily deals to boost their e-commerce revenue without knowing the true long-term value these customers have. Now it’s possible to define a segment by those visitors who had their first visit to the site as a result of the deal. Then it would be a simple task to compare how they performed long-term against those who arrived through other means.
To follow are a few screenshots of the new segment building interface. Google has made it easier to create your first segment by offering a few templates to get you started. Spend some time this month checking your Google Analytics account to see if it has been upgraded to this new feature. And if so -then dive in and build some segments of your own. Or failing that – phone the office and one of our team can help you out.
The New Google Analytics Segmentation Interface
Example of a Pre-configured Segment
So how profitable is your online advertising spend? Finding answers to this question is not as hard as many business owners may think. In this short note I’ll take you through a fictitious dialog with a prospect to show you the steps we follow to reveal if their existing online marketing is forging a path towards future business profitability or short term loss.
I remember the first time I was introduced to this concept of “creating a path to profitability”. I was employed by a dot com company that was full of promise, investor’s funds and unbridled enthusiasm. We had lavish offices, fancy art on the walls and only the best advertising agencies to work with.
Just to give you a guide on how much money was involved back then. We were part of a larger company that between us shared two floors of a recently built office block overlooking Auckland harbour. So it was decided that rather than use the stairs to move between us we would arrange for a building firm to cut a massive hole in the middle of the top floor and build a marble staircase to link the two. I was OK with using the lift.
Anyway, the company was fortunate enough to hit the market at the right time with the right type of product. Low and behold after three months of trading the financial results were in and we had made a profit. Yippee! I was asked to come into the CEO’s office immediately when the figures were released and was told to sit down as he shut the door behind me.
Yes the result was good. I had apparently shown them a “path to profitability”. Now my job was to widen the trail, hire more staff and open more offices to grab as much of the market as we could. We never achieved the same profit figures again. Fortunately this company had deep wallets and a plan to keep moving while the funds were leaking out of the company.
Anyway, back to applying this to online marketing. Frequently people start a conversation with us when they think they are in situations like this, spending too much to achieve very little.
Within a few minutes of us talking we can generally see where the focus needs to be applied and have outlined a very simple path to profitability to follow. Here’s how the conversation usually goes. To make this work I’ve included a fictitious business owner Mike who runs a service business in Auckland. Mike is struggling to make his online marketing pay its way. He spends around $750 per month with Google AdWords and is not sure if this is too much or too little. He is convinced it’s the former.
CONVERSATION STARTS
Ring ring…. we join the conversation after Mike has told me a bit about what he does and how long things have been going.
Chris:OK, so let’s start with the ideal end result – you making sales. When this occurs, what would be its average amount?
Mike:Well it depends on what they buy. But on average I would say $450.
Chris:Now of this amount how much would you be prepared to spend on marketing?
Mike:As little as possible J
Chris:Thank you. I know that every business owner would want the same so let me put it another way, what would be the most you would pay before the cost of creating the sale exceeds the profits it would produce?
Mike: OK, so I know I was a bit glib with the first answer so let’s go with $50. If it costs me $50 for each sale then things still work. I can pay for all my materials, pay the staff a wage and have a bit left over for a rainy day.
Chris:Great, now just so I’m sure – how many of your clients would you expect to buy from you more than once?
Mike:While our industry should have repeat business I must admit that we are not that good at generating it. However, if we were I would expect 20% of clients to repeat within two years BUT I didn’t allow for it when coming up with my very rough $50. I expect my current leads to be paid for by the money we create from their first sale, not those they may produce in the future.
Chris: OK so working back from the sale being made. How many prospects do you need to talk to before you make a sale?
Mike:Again this all depends on the type of work people are looking for. The quality of our leads really fluctuates – especially from the website. But to break it down into averages I would pick that half of those we talk to will become a client.
Chris:So for every two prospect leads you create – one will become a client.
Mike:Yep that’s true, but quite often we cannot get hold of the leads that are generated through the website. I would say that allowing for this we would need five leads to create one sale.
Chris:OK so the $50 needs to be split between these five, leaving $10 as the most you should pay for a lead. Anything more than this and your marketing costs are looking too high. At the start you mentioned spending $750 per month with Google – which should represent about 75 leads at the average cost of $10. How many leads are you getting?
Mike:Not that many. Probably on a good month we would get around 30. I’m not exactly sure – I’ll have to go back and check my email to count them up but it’s nowhere near 75. Sounds like I might have to put a stop to all that Google advertising… I thought it was costing too much!
Chris:Hold on… Before you jump ahead, instead of checking your email can your website analytics tool provide that lead count?
Mike:What analytics? We don’t have any for the site. I do get a raft of reports from the people who manage my Google advertising. Clicks, and impressions – is that what you are referring too?
Chris:Nope. What about visitor counts and page views? The details giving you insights on how your website is performing with the traffic it is currently receiving?
Mike: Sorry – I don’t have anything like that.
Chris: OK. So let’s not jump into cancelling anything with Google just yet. First off let’s set up some analytics on your site and let it run for a couple of weeks to collect some data. Then we should see which keywords you are buying clicks for that are actually delivering the right types of people to your site who then go on to fill in your quote request form. There could be some that do this for $5 and likewise others that do it for $100 and of course some which arrive and don’t convert at all.
Mike:So I presume we would dump those that don’t convert or convert at too high an amount and focus our spend on those that fit below our target $10 per conversion rate?
Chris: You are on the right track but not exactly there. Yes to focusing on the low cost conversions but no to automatically dumping those that don’t convert at all or do for too high an amount. For instance we may find keyword phrases that are responsible for traffic which doesn’t currently convert but between us we feel should. It may not be a problem with the wrong sort of visitor – it may be that the site is not set up to convert them yet. The same goes for those costly converting keywords. Let’s not dump these as again we could have a content issue. And not wanting to layer too much complexity on it too soon, but there could be leads that cost a lot to convert but represent the best types of customers for you.
Mike:You had me all the way through until that last part. Let’s get some tracking going and then we can dig into what spend is creating what.
Chris: I know there’s a bit of complexity in here but just remember that the path to profitable online advertising starts with your ideal cost per lead and works backwards. We know this so with some analytics running between us we can find out the rest.
CONVERSATION END
Yes, I know it’s a very simplistic view and the numbers were made to be nice and neat. However this short dialog should provide some insight on the steps ahead. Give us a call today if you would like to move forward like Mike did.
Last month I met a marketer who works for a New Zealand company that spent $10 million on Google AdWords in 2012. What made this even more fascinating for me was that I had never heard of the company name and I would pretty much guarantee for 99% of you the same would apply.
She told me all of the industries that they operated within and all were legitimate business categories that were quite boring. No exotic borderline operation here. Just a worldwide network of normal businesses that run on the strength of their ability to optimise their spend with Google.
At first I was just shell-shocked by the amount they were spending. I mean just thinking through the actual mechanics of managing something like this was hard to comprehend. For instance, just getting the money to Google each month would be on a whole different level from charging a Visa card. I half jokingly suggested that the Google people must be waiting outside their office ready to collect the next suitcase of cash. Apparently the truth is very boring – automatic bank transfers on a daily basis.
Nevertheless, they must be on a Google Advertising short dial with this spend? Yes they have dedicated account management but only see people who come across from Sydney once or twice a year. (Don’t expect a sales call for your $50k per annum spend.)
Fortunately we were able to chat for a while before the next session of the conference we were both attending began its next session. So what did I learn that I can share with those with a fraction of this spend? Well from what I learnt, here are a few principles that I can share as working well for those keen to squeeze more value from their Google clicks.
Firstly – It all starts with a sound understanding of your “AdWords Numbers”
Now when you are spending over $800,000 on clicks each month you would assume there was some wastage factored in when it came to analysing the effect that the clicks caused. Not in this case. Each and every click was accounted for in precise detail.
So while this company operated a number of websites – think more than 100 – each and everyone used a well tuned Google Analytics account to reveal exactly how much each sale cost in clicks. This was compared to the acceptable marketing spend for the margin they spent. If the sums made sense then they just kept on buying those clicks.
It’s a simple math problem really that was asked every minute of every day. Were they “buying” the sale from Google for the right amount to enable them and Google to remain in business?
Secondly – Once the math is solved then the world is your playground.
This company is based in Auckland but has offices in Australia, the UK and North America. But it all started from solving a very simple problem in Auckland. Could they make the math work selling one service to one set of buyers? Then, once the this was completed they looked for the same buyers in Australia, from there North America and finally the UK.
We have a Google Adwords optimisation client who has done something very similar, all be it on a much smaller scale. Like our $10 million friends they started in Auckland, then moved to Wellington and wrapped up their New Zealand journey with Christchurch before crossing the ditch into Australia via Adelaide to Melbourne and finally Sydney. The core principles we applied together to make Auckland work and have so far successfully been translated as we move around the globe together.
And finally – to wrap up our learning’s from this conversation, don’t think that just because you spent $100,000 with Google last year that you deserve any special treatment. I asked them what they received for Christmas from the search giant (expecting something nice for such a relationship). It was nothing special.
In fact, if you were a customer who came along to our office warming party last year then you left with a gift that cost more. And rest assured we don’t have any online marketing clients spending $10 million per annum with Permission.
For more website marketing information, take a look at our online marketing services, or give us a call on 0800 893 477.
Every month we hold a customer conference call that all of our customers are invited to join. At the beginning of these conference calls we have a section on what is new in the online marketing world that we believe is worthy of your attention. This is a video of the introduction of May’s conference call 2013.
This month we talk about decoding not provided traffic that appears in Google Analytics, new hyper localised Google Maps, the new local business listing rating system and a great new resource to check out from Google!
For more website marketing information, take a look at our online marketing services, or give us a call on 0800 893 477.
It would seem that fishing has now gone all hi-tech. The other day, while wandering along a stretch of Coromandel beach with my ageing and mad Spaniel, I noticed a couple on their quad bike carrying what look like to be a orange torpedo down to the water’s edge. Mello, my Spaniel, was as interested as I and did her best to get in the way as they bent down and fussed away to get the thing started.
Within a few minutes a power of froth was coming from the propeller. While he slowly guided it into the surf she walked back holding a line that joined it to their bike. In a few moments the orange flash was tunnelling out through the surf towing a fishing line of 25 baited hooks behind it. Minutes later all you could see was the golden flash of the light as it buzzed through the surf far, far off in the distance.
I sauntered up to learn more. Apparently the “thing” would cover 1Km in 10 minutes and only needed to be out there for 45 minutes at the right time of day. So all you needed to do was invest an hour each day (and the $2750 for the torpedo thingy”) and there was a good chance you would be hauling your fancy gear back with some additional weight of fresh fish. Great for those short on both time and something for tea.
Not such a good plan if you like to fish the way I do.
Needless to say, the fish are safe when I turn up on the beach. My surfcaster is ageing, the reel is even older and you can smell my tackle box before you see it. The ideal evening fishing for me involves lots of casting, lots of still, and very little chance of taking anything back home. A perfect way to spend 3 hours alone on the beach.
I don’t think I’m too dissimilar to others I see lined up next to me. For us it’s more about the time of peace and quiet with the occasional flurry of excitement thrown in occasionally. The appeal of pulling out 25 snapper in 45 minutes is mildly appealing, that is until I think through the logistics of gutting all that flesh and then finding something else to do instead of heading back too early.
The world of online marketing is a space filled with a mass of technology and services all claiming to do more things in less time, just like our friendly orange torpedo example. Very rarely does it all turn out exactly as sold. (Just as an aside while we were at the beach I spotted a notice in the local store posted by someone who was looking for help as their fishing torpedo had come off its line and hopefully was going to wash up on the beach rather than reach landfall in Argentina.)
This month our newsletter talks to the point of mixing up your online marketing tactics to make good use of those delivered in both a “slow” and “fast” way. The theory being that the best long term competitive advantage comes from applying tactics that take the most time to deliver.
The same can apply when influencing the speed at which people purchase online. A small proportion of your purchasers will dive into their wallets immediately on arriving on your site. Others will need time to ruminate about their decision. Most online marketers spend time influencing those that buy quickly when there’s a larger group who need time to make a decision.
Email marketing comes to mind as a key strategy to achieve success here. By now everyone should be familiar with its use, but rarely is its effectiveness measured in the right way. While most track who opened the message and what links were clicked within it, very few look back and see if by receiving these messages customers were more or less likely to buy again or for the first time. These are the real outcomes which the tactic needs to be measured against.
Paid advertising can be a star here too. Here you can set up campaigns to re-market to those that bought from your website before to entice them back as they trawl the Internet. Likewise, if they came but didn’t purchase then your re-marketing could convince them to come back and make that first purchase.
Direct mail, and dare I say telemarketing, are other strategies that can be deployed successfully here too. Just because you created the lead online doesn’t mean you have to always use the same channel to market to them in the same way. Mix up any of these tactics with to help you achieve the most influence where you can.
And that’s the true illusion here. Whilst technology can present the appeal of achieving more in less time, when it comes to making buying decisions the majority still need time to think things through. That will never change.
So this month think about those who have contacted you and are still thinking about the services or products you offer. What can you send to these who have expressed an interest but haven’t purchased yet? And how about those that have bought before but haven’t for a while? What can you do to entice them back?
Every month we hold a customer conference call that all of our customers are invited to join. At the beginning of these conference calls we have a section on what is new in the online marketing world that we believe is worthy of your attention. This is a video of the introduction of February’s conference call.
This month we talk about AdWords Enhanced Campaigns, Google AdWords Script and important reports to improve marketing efforts.
http://www.youtube.com/watch?v=uK7IFoqKkeo
Every month we hold a customer conference call that all of our customers are invited to join. At the beginning of these conference calls we have a section on what is new in the online marketing world that we believe is worthy of your attention. Below is a video of the introduction of Novembers conference call. This months new and nothworthy information relates to Google Analytics – Universal Analytics and Online and Offline Tracking, Google Webmaster Tools – Disavow Links, Google Adwords – Location Targeting, Google Tag Manager and sending email campaigns at appropriate times.
Every month we hold a customer conference call that all of our customers are invited to join. At the beginning of these conference calls we have a section on what is new in the online marketing world that we believe is worthy of your attention. Below is a video of the introduction of Octobers conference call. You can access research here on the best time to post on Facebook and the mobile marketing strategy.
http://www.youtube.com/watch?v=hnZuN1Zz5-k
Originally published September 2012. Fully rewritten March 2026 to reflect how Google Analytics works today.
Someone tells you over a beer that their website got 50,000 sessions last month. You know yours shows 3,000 users. Should you be worried? Probably not. Those two numbers are measuring completely different things, and one of them is far more useful than the other.
The metrics that don’t mean what you think
This post originally tackled the difference between “hits” and “unique visitors” back in 2012. Nobody talks about hits anymore (thankfully), but the underlying confusion hasn’t gone away — it’s just wearing different clothes.
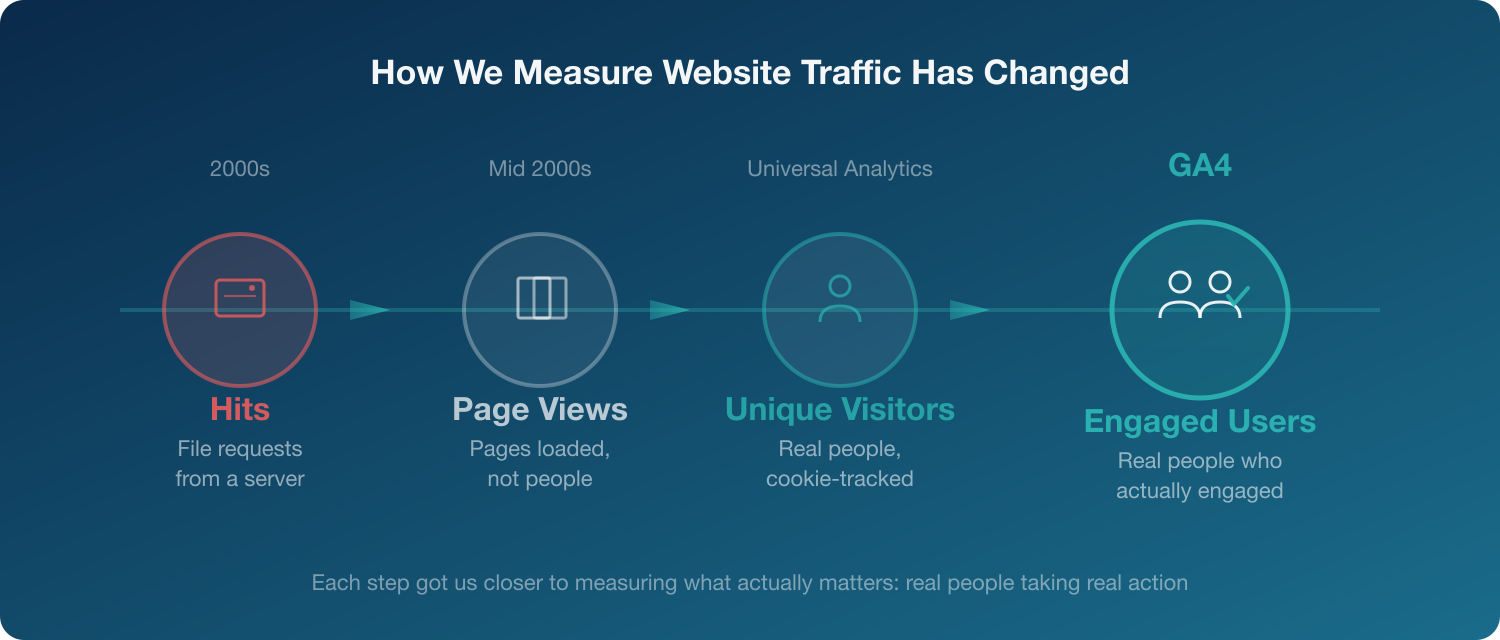
The old progression went like this:
Hits counted every file request from a server. A page with 20 images counted as 21 hits. Completely meaningless for understanding traffic, but people loved quoting big numbers.
Page views were better, but still just a count of pages loaded. Someone refreshing a page ten times looked the same as ten different people.
Unique visitors finally gave us a count of actual humans. Google Analytics (the old Universal Analytics version) set a cookie on each browser and tracked individual people.
That last metric was the gold standard for years. But when Google replaced Universal Analytics with GA4 in 2023, the way we count people changed significantly.
How GA4 counts people now
GA4 introduced a different set of core metrics, and the terminology shift trips up a lot of people. These are the ones worth understanding:
Users. The total number of distinct people who visited your site. Closest thing to the old “unique visitors” metric. GA4 identifies users through cookies, but also uses machine learning to fill gaps when cookies are missing (which happens increasingly often as browsers tighten privacy controls and visitors decline consent).
Active Users. The primary user metric in most GA4 reports. These are users who had an “engaged session” (more on that below) or triggered a key event. When GA4 shows you a user count, it’s usually active users, not total users. Universal Analytics just counted anyone who showed up.
Sessions. A period of activity on your site. Similar to the old “visits” metric. A session starts when someone arrives and ends after 30 minutes of inactivity. One user can have multiple sessions.
Engaged Sessions. An engaged session is one where the visitor stayed longer than 10 seconds, viewed two or more pages, or triggered a conversion event. It filters out the people who landed, glanced, and left.
Engagement Rate. The percentage of sessions that were engaged. This replaced the old bounce rate as the default metric. A 60% engagement rate means 6 out of 10 visitors actually spent time with your content.
Why this matters for the bar conversation
Back to that beer. Your competitor says 50,000 sessions. You have 3,000 users. These aren’t comparable numbers — sessions and users measure different things. One person visiting five times creates five sessions but remains one user.
The more useful comparison would be engaged sessions or engagement rate. Someone could have 50,000 sessions with a 25% engagement rate (12,500 engaged visits), while your 3,000 users at 70% engagement rate means 2,100 quality visits from people who actually read your content.
Neither number tells the full story without context. But at least we’ve moved beyond counting file requests from a server.
The privacy dimension
One thing that’s changed since 2012: cookie tracking is no longer the reliable backbone it once was. Between browser privacy features (Safari’s Intelligent Tracking Prevention, Firefox’s Enhanced Tracking Protection) and cookie consent requirements, a portion of your visitors are invisible to analytics.
GA4 compensates with modelled data, using machine learning to estimate the behaviour of users who declined cookies based on the patterns of those who accepted. It’s imperfect, but it’s a more honest approach than pretending everyone is trackable.
The practical takeaway: your real traffic is likely higher than GA4 reports. Focus on trends and ratios (like engagement rate) rather than absolute numbers, because the absolute numbers have a margin of error baked in.
What to actually look at
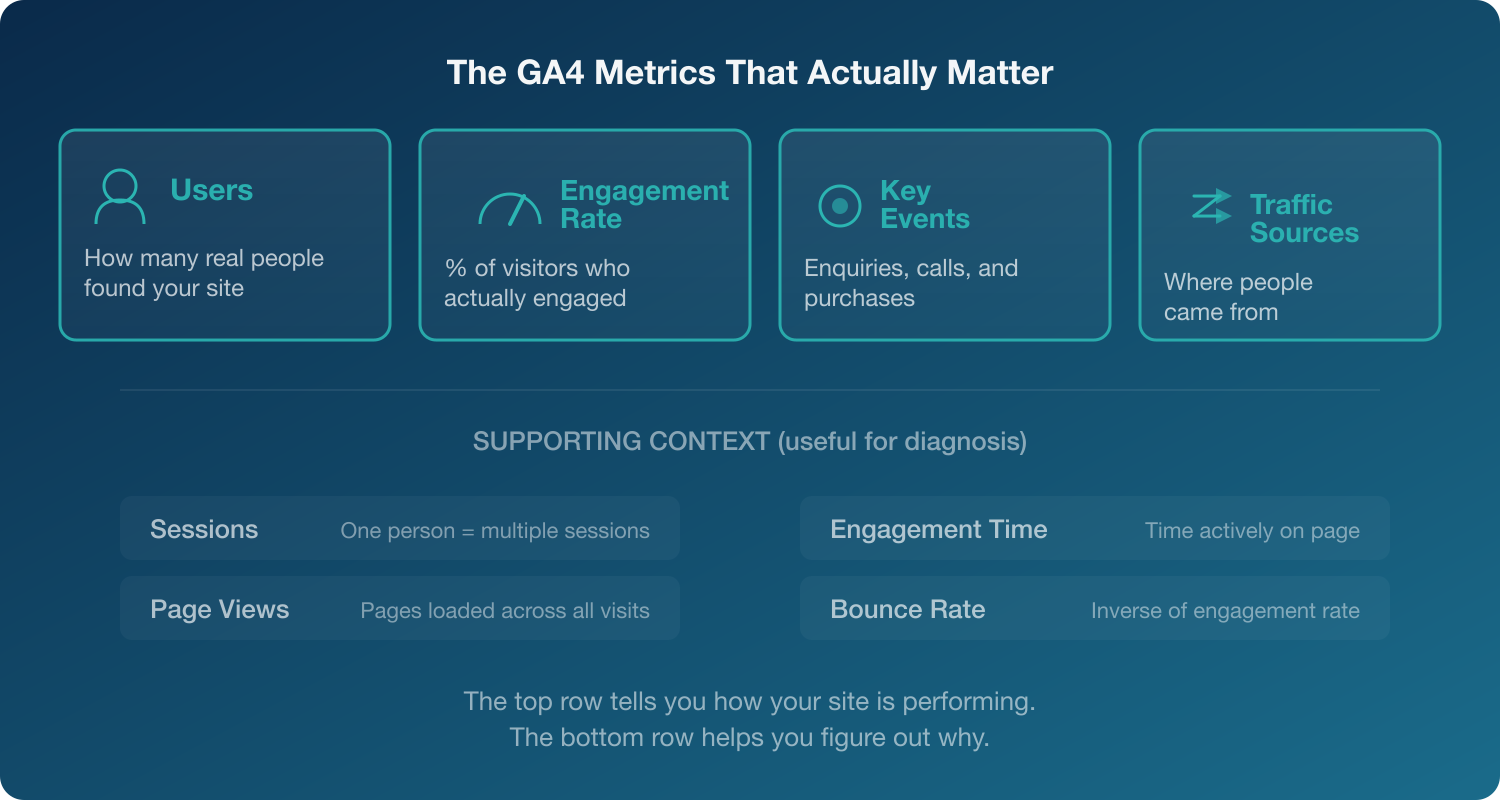
If you’re trying to understand whether your website is performing well, these are the metrics worth tracking:
Users — how many real people are finding you
Engagement rate — what proportion of visitors actually engage with your content
Key events (formerly “conversions”) — how many people did the thing you wanted them to do (enquiry form, phone call, purchase)
Traffic sources — where those people came from, so you know what’s working
Everything else is context. Sessions, page views, and average engagement time are useful for diagnosis, but they’re not the headline numbers.
So next time someone brags about their traffic numbers, ask them: “How many of those people actually did something?”
If you’d like help making sense of your website data, take a look at our Google Analytics consulting services.
Originally published July 2012. Fully rewritten March 2026 to reflect how Google Ads works today.
When a multi-location business sets up separate Google Ads accounts for each branch, they almost always end up spending more and getting less. Here’s why one well-managed account will outperform a handful of fragmented ones — and why the fix is simpler than most people expect.
Every now and then, a business with multiple locations comes to us with the same story. Each branch has been running its own Google Ads account. Each branch manager picked their own keywords, wrote their own ads, and set their own budgets. On paper it sounds logical — local people managing local advertising.
In practice, it’s usually a mess.
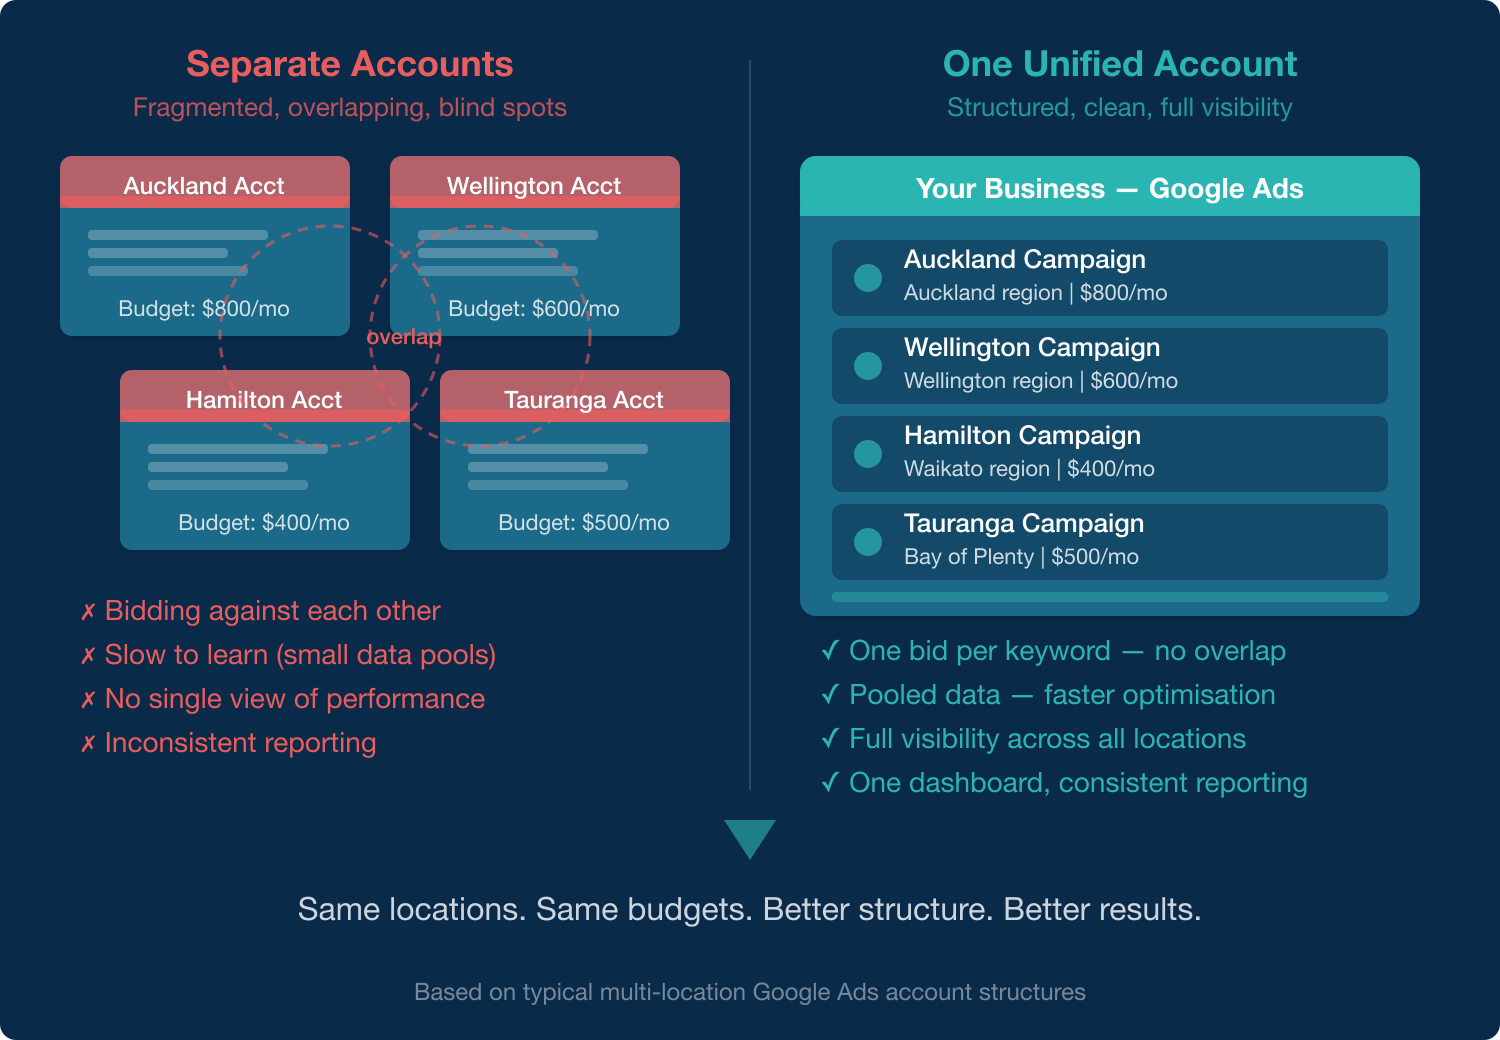
The branches are bidding against each other, driving up their own costs, and none of them have enough data individually to optimise properly. Meanwhile, their competitors — running a single, well-structured account — are getting better results for less money.
Here’s why consolidation works.
You stop bidding against yourself
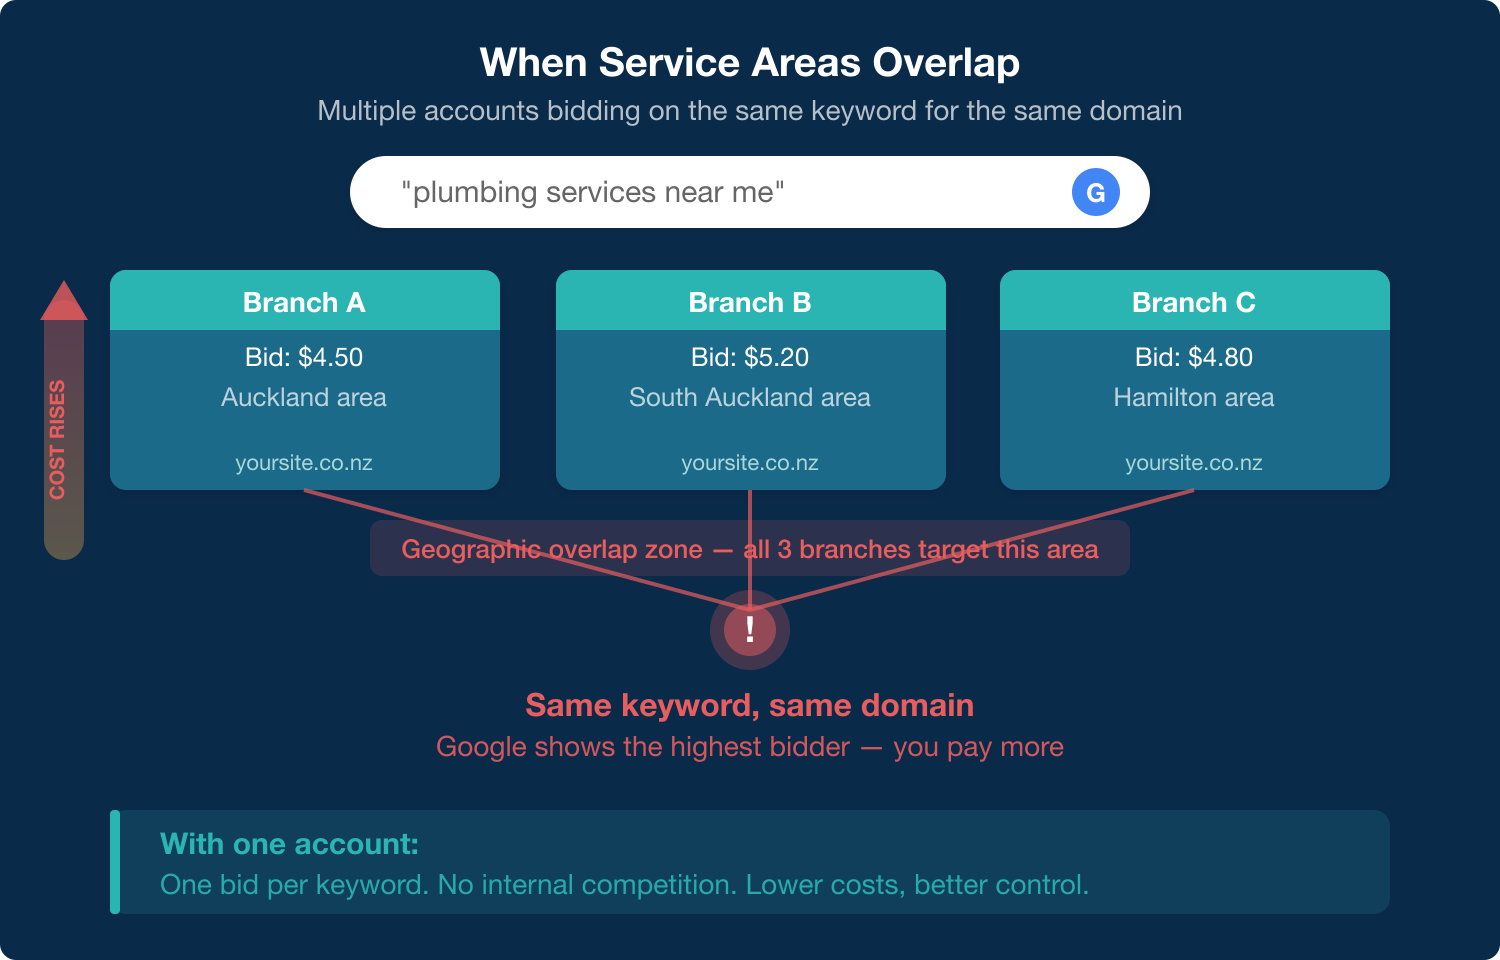
This is the big one — and it’s especially common with franchise-style businesses where service areas overlap. Google only allows one ad per domain for any given search. So when two branches are both targeting the same area — say Auckland and South Auckland, or Hamilton and the wider Waikato — they end up bidding on the same keywords for the same website.
Google’s response? Show the ad from whichever account is willing to pay the most. The business ends up in a bidding war against itself, and the only winner is Google.
Even branches that seem geographically separate can run into this. Google’s location targeting isn’t a sharp boundary — it uses a radius and user signals, so a searcher on the edge of two territories can trigger ads from both accounts. The more branches you have, the more overlap creeps in.
In a single account, there’s one bid per keyword. You control exactly which campaign serves which area, with no overlap and no internal competition. The cost comes down, and you can direct traffic to the most relevant landing page for each location.
Your data works harder
Google Ads rewards accounts that have enough data to learn from. Every click, conversion, and search term teaches the system what works. Split that data across five or six separate accounts and each one is learning slowly, in isolation.
A consolidated account pools all of that learning into one place. Negative keywords surface faster because you’re seeing more search terms. Smart bidding strategies have more data to work with. Quality Scores — Google’s measure of how relevant your ads are — tend to improve because the account has a stronger track record.
Think of it as the difference between five people each reading one chapter of a book, versus one person reading the whole thing. Only one of them actually understands the story.
You get proper geographic control
One of the concerns people raise is: “But we need each branch to show ads in their own area.” That’s a fair point — and it’s easily solved within a single account.
Google Ads has built-in location targeting. You can run separate campaigns for each region, each with its own budget, ads, and landing pages. The difference is that it all lives under one roof, so you can see the full picture and make decisions based on the whole business rather than one branch’s view.
You actually know what’s going on
When each branch runs its own account, reporting becomes a nightmare. Metrics get measured differently, budgets are tracked in different places, and nobody has the full picture. The head office asks “how are our Google Ads performing?” and the answer is a shrug followed by a spreadsheet cobbled together from six different sources.
A single account gives you one dashboard with consistent data across every location. You can compare regions, shift budget to where it’s working, and spot problems before they become expensive.
The transition is easier than you think
Most businesses expect the consolidation to be a major project. In reality, the hard part isn’t technical — it’s getting agreement from the branch managers who’ve been running their own show. The actual migration is straightforward: rebuild the campaigns in a single account with proper location targeting, pause the old accounts, and let the data start compounding.
This is something we handle regularly as part of our Google Ads management work. If you’re running multiple accounts and suspect they’re working against each other, complete the form below — it’s one of the more straightforward problems to diagnose and fix.
Let’s imagine I had a coin-operated Gumball machine that delivered, in place of sugar-coated balls, a steady supply of OK-quality prospects. How much cash would you place in the machine to get each prospect?Now most would say “as little as possible”. This I understand; that’s normal human nature at work. But what if I told you that you are not the only person who was able to use the machine?
You see, behind you are your competitors eagerly waiting to use it once you are finished. Plus, the rules state that you pass to the person behind you when you choose not to enter any more money. So,knowing this, how much would you enter before you decided to pass it to the competitor behind you?
Got you thinking a bit more now?
Great, because the Google AdWords advertising system is very similar to that Gumball machine.And every time you launch your campaign you are figuratively lining up next to your competitors as you all try to attract the same profile of prospects.
Now,getting back to the Gumball experience, the smart person would have done their sums before their turn came up.And while the others may spend too little and miss their turn or spend too much and market themselves out of a business, the smart ones would know exactly how much to enter before they expected a prospect to arrive, and when to pass if it didn’t eventuate.
So let’s work through the steps they would have taken to make them so smart. Firstly, they would have calculated the likelihood of average quality prospects turning into clients.Then they would have a good indication of the average amount of profit (not margin) that each customer was worth.
Calculating customer worth becomes interesting when customers are retained for a long time. They can end up becoming very, very valuable.In these cases, worth can track profits for not only the first sale but right through to an expected multi-year life span.
In markets like these the Gumball machine is ravenously hungry for cash before it yields a prospect as competitors are willing to load up coin after coin to get that one prospect.The same applies when prospects have a high propensity to convert into a customer coupled with a high transaction value. In both of these cases you’d better get used to shoving in those coins to get the growth you need.
The Gumball machine concept is relatively straightforward but I would suggest that less than 10% of Google AdWords advertisers know the number at which they should buy prospects and, conversely, when they should pass to the person “behind” them. Based on my unscientific research over 10 years of online marketing experience I have only come across two clients of ours who, when asked for their “gumball number”,were able to provide it.
The first was a world leader in a very competitive health and fitness arena;the second was a highly successful one-person business in financial services. Both knew the marketing “numbers” of their business down pat. In each case it was – and still is – a pleasure to work with them. So long as we can provide them OK-quality prospect leads at a cost below their “Gumball” number then all remains well in the land of online marketing.
So why do so few advertisers know this number?
One reason could be that those selling traditional advertising never touted it as an effective way to measure performance. “Investing”$1500 on a newspaper advertisement and not being sure if the 10 leads captured that week were solely due to it makes it either a great purchase or a shocker. Whereas online there’s more measurement than you can shake a stick at and determining the exact cost for each prospect captured is possible with just a few clicks of your mouse.
Secondly,as business owners we may have found the whole financial side of measuring marketing performance a bit daunting. If you are in this camp, then this book may help̶Found Money: Simple Strategies for Uncovering the Hidden Profit and Cash Flow in Your Business by Steve Wilkinghoff. You can find it on Amazon here. As a non-financial person myself, I thought it did a great job of showing you the simple steps necessary to create some lasting financial insight with regards to your marketing spend.
Sorry, there really isn’t any good reason to not know your “Gumball number”.
The giant Gumball machine of online marketing is here to stay. And while I relate it directly to Google AdWords, in reality it signifies the complete online marketing space. Your option is to either stand in the queue armed with the right knowledge or take your chances like the rest of them. Personally I would prefer if it was the former. Why not give us a call today if you think this is a good idea too.
I am reliably told that successful baking is a lot like chemistry. All you need to do is follow the instructions, add in the right ingredients in the right order and you are all set to create the same successful outcome of your “experiment” every time. Somehow, it never seems to work the same way for me. Either I rush things and miss something out or, even worse, mistake one thing (think salt) for another (think sugar) and a disaster is on the way.
Nevertheless, get it right and what you see in the image at the top of the recipe page should be close to what you take out of the oven. And let’s face it, it’s that image we all want. Yep, a nice thick slab of carrot cake with a very non-healthy spread of cream cheese icing. Yum scrummy. The thought of munching through this makes all the hassle of creating it and cleaning up afterwards worthwhile.
E-commerce websites are nothing like carrot cake. That I know. I also know that their owners all have revenue and profit targets they want them to meet. And for me that’s the picture at the top of the recipe – the bit that gets them excited. However, for many, the bit below – the recipe they need to follow to make the image a reality – that bit is missing. What exactly do they need to do to “bake” their way towards these numbers?
All this came up during a recent customer planning session. We were working through the next 12-month target for a very successful e-commerce website. The target – or the yummy picture that got us all excited – was very enticing too. Double digit growth was expected in both top- and bottom-line numbers. But what was the recipe they were going to follow to make this a reality? There were a few blank looks around the room so I started with the carrot cake analogy and then as a group we worked through designing the recipe they would need.
Fortunately, an e-commerce website requires fewer ingredients than your average carrot cake. The four staples are: visitors, customers, purchases and costs. Of these, it’s the customer part that’s the most important to sort first. The outcomes of the work in this area drive the marketing costs you will need to afford and with it an understanding of the visitor counts this expense needs to generate to make it all work.
So how many customers did they need to achieve their goal? Was it, say, 5000 people spending $150 each or 1000 spending $750 each? And of these customers how many would they expect to buy more than once during the year? And of this group what would their average annual spend be? These are very simple questions that can be deceptive in the amount of work required to find credible answers for. In this case, the client had to go away and analyze their previous 12-month sales figures and then spend a few days drilling through this data to reveal the answers they required.
Fortunately for them they had a great business, selling a great product that customers purchased reasonably frequently during the year. And of these three wins it was probably the last one that was the most important. Repeat purchase e-commerce websites are so much easier to make work. Email marketing fits nicely into this space too. So does paid search. You can afford to enter this market and pay high click costs if you have the promise of a repeat purchase customer at the end of it all.
Conversely, businesses built on once-only purchase activity are a challenge. To make these work the margins need to be good, with strong and obvious points of differentiation to make them sustainable. Both of these are hard to create and even harder to protect.
But as I mentioned earlier, thankfully this wasn’t the case here so we mapped out expected sales from repeat purchasing, allowing for some increase. Some of the margin from this work would support our email marketing efforts – a solution ideal for customer retention. The gap we had left over was a new customer revenue line. This was spread over the months ahead – allowing for some demand fluctuations during the year based on seasonal changes that affected their industry.
Then we had traffic to sort. We had a good understanding of the site’s conversion rates for new customers based on the last 12 months so we could work out these figures and calculate the required visitor growth to make the conversions we wanted a reality. We then split this between SEO and paid search, based on the ability of specific keywords to reliably bring us new customers.
After a couple of relatively focused sessions and some deep analytical work at their end we had our recipe. And yes, it had some assumptions that needed validation as the year progressed. Things like “we expect existing customers to spend 15% more this year due to our improved email marketing” and “our product margins will remain the same”. But still, it was there ready to be worked through during the months ahead.
So are you an e-commerce website owner who just stares at that nice revenue and profit number hoping it will eventuate? Well, now’s the time to stop hoping and start creating the ideal recipe for you and your business. Let me know if you need any help with your ingredients.
Have fun.
I would like to say that this new product came from some extensive brain-storming completed by the team, incorporating the latest in mind-melding techniques. But I would be lying. It all started with a customer and a problem.
This customer owned a lead generation website that did an above-average job of taking paid and organic search traffic and converting it into good quality sales leads. Each month they would review their traffic and lead count to match up how their conversion rate was going. And if it needed improving – think every month there is room for improvement – site changes would be tested to edge this rate further upwards. The whole process lived and breathed on hard facts,all underpinned with a strong desire to grow faster.
Things were going well. But still their business needed more leads to achieve the growth they had planned. So my attention turned to their inbound call volumes. Yes, their website had a phone number but it was their general office number, which they used for all their other marketing too. Now we knew that some prospects called using this form while staring at the website – but we didn’t know how many took this option and the effectiveness of turning this traffic into leads.In one meeting I made a strong suggestion that this phone traffic needed tracking with as much rigor as was being used for web tracking. Fortunately, they had a spare number they could use and so we swapped out the website number with this just to see what turned up.
Needless to say, the fact that this whole train of events spawned a new product points to what they found being quite a revelation. For instance, the site was generating as much phone traffic as form submission leads. And let me remind you that the online lead count was at the top end. Everyone was surprised with this one.
But then when they ran the numbers through, it was the conversion rate of this inbound call traffic into quotes by their call centre that was the real issue. The numbers were startling. It was running at under a quarter of the online conversion rate. So that was the real target for achieving fast growth.
All they needed to do was double the effectiveness of how they handled inbound calls to bring it up to about half of the online conversion rate and they would more than double the total number of quotes the company did – without spending any more in marketing cost.
Now, not everyone has a spare telephone number hanging around waiting to run a test like this. Which is why we are launching this new product.
It’s a simple concept. We supply you with a phone number (both regional and 0800 numbers are supported) that sits on your website or perhaps in your Google Ad. Anyone who calls that number is routed directly to where you want them to go. It’s a seamless process for the caller. Each month you receive a tracking report from Permission that shows you how many people used that number, the length of the call, etc. Plus, with some extra magic, we can integrate this into your Google Analytics account so you can see the calls coming off your website as individual events.
And if you want you can turn on call recording and have access to recordings of all the calls that come your way. There’s a very nominal monthly line rental fee, a small minimum term, and even smaller costs per minute for the calls to be routed where you want them. Tracking and measurement are a snip to do for your online marketing activities. Now you can put the same “blow torch” of accountability to your inbound call work to see how you fare in this area. Contact us today on sales@permision.co.nz if this makes sense for your business.
 Google Analytics recently updated the way in which users could build segments. The screens got a tweak to make them easier to use and a fair dollop of extra parameters were added. This all sounds super geeky and of little use to most business owners, however because I’m writing about it here I can assure you that the opposite is really the case.

 So how profitable is your online advertising spend? Finding answers to this question is not as hard as many business owners may think. In this short note I’ll take you through a fictitious dialog with a prospect to show you the steps we follow to reveal if their existing online marketing is forging a path towards future business profitability or short term loss.