I believe you can tune your website to become the lead-generating machine you wish it to be, with the help of Google Analytics. This free product can tell you how many people visited your site, where they went and if they completed any “goals” you wanted them to achieve. Facts, facts and more facts.
It’s all good stuff until something crops up to make these facts “questionable”. Well, that something has arrived: Google Analytics spam. I suppose it was just a matter of time.
Back in November 1999, as part of an email marketing company launch, I flew an email marketing guru from the US to speak to 300 people. His first question, “Does anyone receive email spam?” Not one person raised their hand. We all know how that quickly changed – thankfully technology won and very few spam emails make it into our inboxes these days.
Google Analytics, however, is now starting on that journey. With a reasonably high level of confidence I can say that your GA reports will unfortunately have spam in them.
Want to check yourself? Just look in the “Acquisition > All Traffic > Referrals” area and see websites sending you traffic like “best-seo-offer.com” or “100dollars-seo-com” or the crowd favourite “free-social-buttons.com”. It looks like these websites have sent you traffic but whatever you do, do not visit them… unless you are keen to test your antivirus software.
These sites have used a technical loophole in the Google Analytics tracking protocol to arrive in your reports. Thankfully we are not talking thousands of visits each week but if your website attracts a few hundred visits each month, having a hundred or so spam visits in the mix could be a problem.
Spam will skew your results. It will make your site look better in one area whilst looking worse in another. For instance, your total traffic will go up. Which may make you smile. Until you notice this peak came from referring traffic from rubbish sites. Not helpful.
Your website’s bounce rate will climb too. That’s the number that tells you the amount of visitors who arrive at your site, look at one page, and promptly leave. Nearly all of this rubbish traffic has a bounce rate of near to 100 per cent, which will quickly push a low-volume website into a scary bounce rate average of 60-70 percent. Your time and engagement stats will also plummet as spam shows up as spending less than a second on the site on that one page only. Argh! None of this is good.
You have a few options to clean things up – here are my top two:
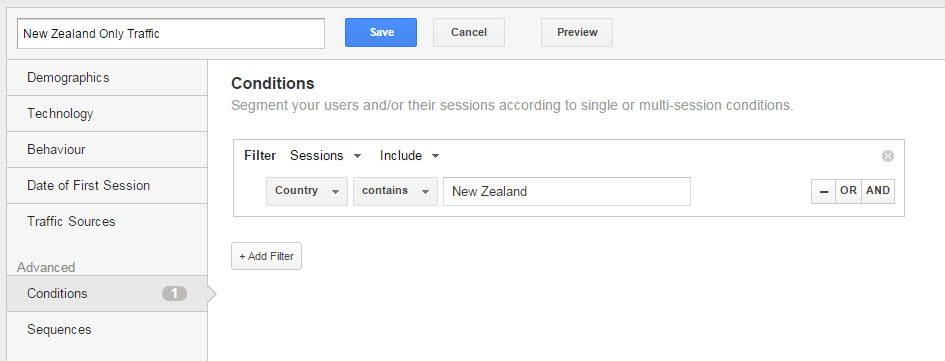
First up, if you are only interested in reporting on New Zealand traffic then go ahead and create a segment to only show traffic from this region. Click on “Add Segment” > “New Segment” > “Conditions” > pick “Country” type in New Zealand and then save your new segment as “NZ Only Traffic”. You now can apply this segment across your reports and see all that nice, pure, New Zealand traffic.
Secondly, if regions outside of NZ are of interest to you, including those spam-creating places such as Russia, Indonesia or the like, then you need to create a “Filter” in your Admin area to remove the specific websites that are causing you a problem. This fix is a bit more technical and you may need support from the person who set up your Google Analytics account to help here.
Yes, I know it’s a pain but I’m backing that in a few months Google will have a nice, clean, technical fix to it all. But in the meantime, these are the ways forward.
(As published in the Sunday Star Times, May 24,2015)
Last week we covered how you can use Google Analytics to track positive stuff happening on your website, including sales leads, online purchases and newsletter subscriptions. We did this by configuring the “Goals” section of your Google Analytics account.
Now that you have goals in place and are tracking the right things, you can use the numbers to measure and monitor how well your website performs, based on the traffic it receives.
For instance, you may now see that just five percent of your visitors take up your option of requesting a quote. Or that a measly two percent actually whip out their credit card to buy from your online store. Not great.
How can you improve these numbers and the success of your website? Uncover all you can about those who DIDN’T make a purchase or become a lead (ie those who didn’t get in touch for more information). Use your Google Analytics account to learn who they were and what pages they clicked – doing this will hopefully help you figure out what it was that stopped them from becoming a customer.
In the “real world”, this bit of the process is a bit like having someone standing outside your bricks and mortar shop and asking those that leave empty-handed a few questions.
Google Analytics can tell you some good stuff about your website visitors, including:
Learning these things about visitors who fail to become customers will give you helpful insights you can use to tweak your website. Depending on your results, your actions to improve may include: fast-tracking your mobile website project knowing that people arriving from a mobile phone are twice as likely to convert compared to those using a desktop computer; reevaluating your spend of a specific marketing channel because so few visitors from this group end up as buying customers; or making your newsletter subscription option on your website even more prominent because you can see what a good job it does “warming” subscribers up who then go onto request a quote.
The more you know about the “who” behind those who don’t convert, the easier it can be to understand why your results may be struggling. Use your Google Analytics reports to do some detective work on your non-converters and see what valuable – and profit changing – information you can uncover.
Next week I’ll cover how Google Analytics can show you the paths these non-converters took around your website before they left without buying – very helpful indeed.
Chris Price owns Ark Advance, a web optimisation business that specialises in online marketing. www.arkadvance.com
(As published in the Sunday Star Times, June 07,2015)
I believe that websites can be optimised to act like vibrant salespeople rather than boring one-dimensional brochures. But, like the best salespeople, they need to be measured, monitored and have their performance and progress tuned in order to work at their full potential. Google Analytics is the ideal tool for this job – even better, it’s free. You just need to learn how to drive it.
Last week I explained how to use Google Analytics to uncover as much information as you can about those who visit your site but fail to convert into anything exciting, like revenue or leads. Information like where they were physically located, their gender and age, and what part of the Internet they were at before they clicked on your site. I likened this to someone standing outside your shop with a clipboard, questioning shoppers for similar information.
This week I’m on the quest for more answers to help you uncover the real reasons why so few of your website visitors do what you want them to. This time we want to find out why they left your website, empty-handed or without leaving their details for more information.
In a bricks and mortar store, you could get some insight into customer behaviour by surreptitiously following someone around your store, recording where they walk, what they look at and for how long. Doing this may alert you to why some customers leave without buying anything.
You can do this for your website, too, by checking out what order visitors browse your web pages.
There’s a great report inside your Google Analytics account called “Behaviour Flow”, which you’ll find in the “Behaviour” section. This is a cool graphical view of what pages people see and the order in which they see them.
The 80/20 principle applies neatly here: 20 percent of your pages will capture 80 percent of your visitors’ attention. The Behaviour Flow report will tell you which pages are in the small but powerful 20 percent group – you’ll find the home page generally falls into this category. Since these pages are so popular and make so much impact, you want to make sure they are working as hard as they should be. You only get a few pages to make a first impression, as such – this report will show you which of your pages are failing on the good impression front.
Now, you would expect (or hope) to see people moving seamlessly through your website, from page to page, before they eventually convert into a customer or lead. But if that’s not happening, you need to figure out which is the problem page. Looking at your report, which of those powerful 20 percent pages do visitors most commonly exit from? What’s the last page they view before they disappear off your site? If you can see a pattern here, you need to tweak or rework that page in order to stop losing potential customers.
It’s a bit like discovering the sales assistant in your popular jewellery area of your store is putting customers off – once you’ve found they’re a problem, you need to performance manage them.
For example, do visitors check out your home page then your “Services” page but disappear after looking at your “About us” page? You need to do some work here. Look at reworking your copy, design or images on the page – is it something you’ve said, or not said? Does it read badly or not have enough information and credentials to convince people that you’re the best? Get the help of a copy-writer if you need it.
You also need to ensure you make the next logical step for the visitor more obvious – where are they meant to go from here? If you want them to head to your “Book an appointment” or “Sign up to our newsletter” page, make it clear. Website visitors respond very well to clear direction.
Chris owns Ark Advance, which specializes in online marketing and website optimisation, helping businesses sell more online. See www.arkadvance.com
(As published in the Sunday Star Times, June 14,2015)
Google Analytics can tell you some really helpful stuff, including where your web visitors were before they clicked onto your site. Liken this in the physical world to someone standing in front of your store and asking people why they chose to visit your shop. Some may tell you they were already customers who read your recent newsletter, others may have noticed your ad in the newspaper and a few may have decided to visit after noticing your post on Facebook.
Why is this good to know? It can help you discern which of your marketing and advertising brings you website traffic and which of those avenues is the best at providing a reliable stream of high-converting leads. (Not all marketing is equal – you might do something that drives hoards of people to your website, but not one person buys something or becomes a sales lead. This may show your marketing choice is attracting the wrong audience for your product or service.)
There are five main streams of traffic that Google Analytics focuses on:
1. Direct traffic
These people know your website address and have typed it into their web browser. Regular customers will do this, but so will those who see your web address in a printed ad, hear your ad on radio or see your domain name on TV.
2. Referral/Social traffic
These visitors were browsing another website and followed a link to yours – it may be from a news story about you, a comment in someone’s blog or directory websites. Your social traffic comes under this category too, such as Facebook, Instagram and LinkedIn. Facebook traffic is further broken down into desktop and mobile sites, so you can tell if they’re viewing your site from a phone, tablet or computer.
3. Search Engine Traffic
These are the visitors that came from a Google search – those who click on organic results, not your paid Google ads. GA will show you how much traffic came from this area and how it performed but it won’t tell you the actual keywords they used to find you ie what they typed into the search engine. (If you buy advertising with Google you can access this keyword data.)
4. Email newsletter traffic
This is where a few people trip up. Let’s say you spend the afternoon crafting and sending a cool customer email newsletter filled with links back to content on your website. If those links are set up to be exactly like they are on your website, this traffic comes under your Direct Traffic category. Not so good. Not only does it warp your idea of how many people know your URL or website address, it also thwarts you from being able to tell how effective your newsletter was on delivering highly engaged visitors to your site. To avoid this, you need to configure your email tool to add in some extra bits to each link to allow GA to place these visitors in their own newsletter “campaign”. This will give you an accurate picture.
5. Paid advertising traffic
Your GA account will treat your Google AdWords advertising in a very special way (of course, considering they’re both Google entities). GA places all the data that relates to it in its own AdWords category. Here you can drill down into the exact keywords that were clicked (so you can see which are working) and the outcomes they delivered (ie did they deliver profitable leads).
Look at your different traffic types and you can make business decisions like:
– Noticing with glee that your direct traffic gets a sizable bump when your ad plays on radio – and that this traffic also delivers a bump in conversions.
– Reaching out to a website owner who is sending you great traffic via referral traffic, to see how you can advertise on their site to entice more visitors.
– Realising that only 20% of your Google Adwords keywords are converting so deciding to pause the other 80% and switching your budget to those that are working.
This week, dig into your different traffic types and see how they perform on your website. You’ll find all this in the “Acquisition” part of your account.
Chris Price owns Ark Advance, a web optimisation business that specialises in online marketing. www.arkadvance.com
(As published in the Sunday Star Times, June 21,2015)
From the response I have been receiving to these articles, it seems that a growing number of business owners would love a website that did its job well and delivered a steady stream of high quality leads. Unfortunately, what’s more common is that business owners spend time building a new website and then tear out their hair wondering why it’s not made a jot of difference to their business. Alas, with websites, it’s not a simple case of build it and they will come but Google Analytics (GA) does a good job in helping you understand what areas you can improve or tweak your site in order to improve its performance.
Time is a good metric to keep an eye on. It needs to be optimised in two ways: firstly, by increasing the amount of time your visitors spend on your website and, secondly, by reducing the days between their – hopefully – multiple visits. It’s a bit like making sure those in your bricks-and-mortar shop keep walking around and browsing instead of dashing for the door. In the real world, you’d perhaps achieve this by adding nice couches for their partners to sit while they wait or installing an in-store cafe to keep them there and highly caffeinated.
To tune the time spent on your website, there are a number of strategies you can employ:
Content renovation.
Number one on your list should be improving your content. Last week we talked about how to use GA to find the 20 percent of your website pages that are shown to 80 percent of your visitors. Start with that 20 percent when upgrading your content – you want to make sure the pages that most of your visitors see are at their most captivating. Be aware that your content may need more of a renovation than a cosmetic makeover: think beyond tweaking words and look at your images, design and overall content.
If one of your pages is word-heavy and hard to digest (read: daunting and boring), consider using a well-designed infographic or an embedded video to share that content instead.
Email marketing.
Enticed your visitors to sign up for your newsletter? High five! Your ability to get their attention has just sky-rocketed. Now they no longer have to return to your site to see what’s changed and you have a direct line of contact. Deliver a value-packed newsletter and each edition will move them closer forward to becoming a customer.
Use remarketing to bring them back.
This is a nifty type of advertising that helps reduce the time gap between visits. Remarketing is a Google product that allows you to show banner-style advertising on sites other than your own. The brilliant thing is that your advertising is only shown to those who visited your website. You can set these ads to reach visitors who didn’t convert (ie buy), encouraging them to come back and have another look at your site, as well as those who have purchased from you before, reminding them to come back and purchase again.
So there you have it – three good ways to improve your GA time metric.
Speaking of time, there’s another time issue we should mention: pages that take an age to load.
Don’t expect your visitors to wait too long for that next page to appear. The faster your pages load, the more likely your visitors are to stick around. Look at the “Behavior” part of your Google Analytics account to see the current selection of “Site Speed” reports available. Not only does GA tell you which pages have the most room for improvement, it also tells you what to suggest to your web developer to get the problem solved. How thoughtful is that?!
Chris Price owns Ark Advance, a web optimisation business that specialises in online marketing. Ark Advance also offer a free monthly email newsletter focused on helping business owners grow their services online – sign up for free at www.arkadvance.com.
This month I’m swapping the word “Report” for “Feature” to highlight the Intelligence Event option available in your Google Analytics account. This allows you to configure your account to send you an email when certain predefined events occur on your website.
What kind of events? For example, if your Social Media traffic delivers traffic above a certain threshold. Or your site receives traffic from a certain geographic region. You can define what’s important for you during configuration and then sit back and let Google email you when it has to.
(As published in the Sunday Star Times, May 10,2015: http://www.stuff.co.nz/business/68319798/counter-your-bounce-rate)
How about a bit of audience participation to explain how the “bounce rate” works in Google Analytics? Imagine you’ve printed off the pages of your website (your home page, About Us, Contact Us etc) and laid them out on the floor in front of you. Now sit back, look skyward and imagine your website visitors falling onto these pages.
For most websites, you’ll find people stacking up on your home page – their first port of call. Those with a highly optimised website will see people falling on a more even spread of pages. (If no one falls from the sky at all, your website is a write-off – start again.)
The pages these visitors are landing on are what Google Analytics terms – guess what – your “landing pages”.
If your home page does its job well, you should see your visitors stand up and jump from this page to another. And another. And another, as they move around your site. If they stand up and walk away from the scene, never to be seen again, your home page has problems. Those people who fall onto your home page and then walk away forever is what Google Analytics calls the “home page bounce rate”. GA shows this in a percentage form.
It’s vital to track the home page bounce rate because the home page so important to the performance of your website as a whole.
The main role of your home page is to welcome and help your visitors find what they are looking for. It’s kind of like a salesperson in a shop, meeting and greeting new customers and letting them know where things are.
A bad home page is like having a nose-picking, talking-to-their-friend-on-the-phone, swearing like a sailor salesperson – a terrible first impression that will make any new customer swiftly exit the store, never to return.
With the home page bounce rate stat, the lower, the better. Our best clients have home page bounce rates below ten percent, while others struggle with 50 per cent or higher.
Your website’s “bounce rate” is the percentage of people who leave after only viewing one page ie the page they landed on. A target value here is between 20-40 per cent.
Some visitors will fall onto one page, stand up and walk around a few other pages before they walk away. The page that they stand on before they walk away is called the “exit page”. If you look at your Google Analytics and see your Contact Us page has a very high Exit Rate, don’t worry about it: your visitor has probably found your phone details, email address or shop address before they’ve left your website.
Have a look at your Google Analytics for the month. What’s your home page bounce rate like? How does it fare when compared to your site’s average bounce rate? Too high? Focus on improving it – perhaps move some content around, add to what’s there to entice people to move deeper into your site or even look at a redesign so that it is attractive as well as easy to understand and navigate.
(As published in the Sunday Star Times, May 17, 2015: http://www.stuff.co.nz/business/68483238/track-your-websites-performance)
Hopefully you now view your website as a salesperson rather than a brochure and you realise you can use Google Analytics to improve how your website is working for you. This week I want to show you how to configure your Google Analytics to track the bits that really matter. How would you measure the performance of a salesperson if you didn’t keep track of the sales they made? With a great deal of difficulty. Same goes for your website. Keep its performance on track by putting some goals in place.
Unfortunately, your Google Analytics account isn’t automatically set up to measure the sales made by your website – this is something you have to sit down and do. But it’s most definitely worth your while. How can you measure performance if you don’t track it?
Let’s cover what you may want to track.
For those with an e-commerce website, the outcomes you’ll want to track are quite straightforward. You’ll want to track how many online sales you’ve made, how many people signed up online to your newsletter (or for other bait, such as a “Cheat Sheet” or “Helpful Guide to”) and possibly how many viewed your website videos.
If your business sells services (such as accounting or cleaning), it’s a bit different. Your website is probably there to generate leads – it tells potential customers who you are and what you do, before prompting them to get in touch with one of your salespeople, who will then (hopefully) convert it into a sale. While we can’t track sales on service-focused websites, we can track interest. This includes visitors who viewed videos, downloaded PDF documents, completed quote request forms or filled in Contact Us pages. Visitors doing some or all of these actions are obviously more engaged than those that don’t – they’re showing interest.
So you want to track all the website actions that show engagement (as we’ve outlined above). To do this, head over to the “Goals” section of your Google Analytics account and work through setting them up.
Once this is completed, Google Analytics will help you create the Key Performance Indicator (KPI) that will let you know if you need to make any website changes to improve each goal. For instance, your reporting may tell you that 2% of your website visitors complete your Contact Us page. Or that just 3% of visitors to your homepage play the video that’s there. Or only 0.5% of visitors buy something from your e-commerce website. All of these results are on the low end – but at least you’ve started tracking them and are now aware they need work. I’ll share how to do that next week.
The main thing is now you know where you stand. Well done for getting this far and having some Google Analytics goals set up – based on my experience of reviewing hundreds of Google Analytics accounts, just doing this puts yourself in the top 35% of website owners.
Thank you to all those who turned up for our inaugural event last month. During this session I covered “Growing your business through Google without buying them a new plane”. The content for our July 23rd session is now finalised (see below) and you can register for the event here. Customers and prospects of Ark Advance should have received a voucher code by now.
5:10pm – Understanding The Fundamentals of Online Marketing
6:20pm – How to complete a web development project and still talk to your web developer
This month I kicked off our first “Thursday” by presenting on “Growing your business through Google without buying them a new plane”. Customers who couldn’t make it will receive a pre-recorded version of this presentation. Here’s a brief synopsis.
First, I reviewed how many small businesses in New Zealand have staff (approx 97,000), and then surmised that they could also afford to advertise at approx $300 per month with Google. And allowing for 50% of this spend being wasted through poor advertising choices led to a calculation – 97,000 x $150 per month – which comes to $174 million. With a new Airbus A320a costing a piddling $123 million, I had to allow for a few “modifications” to soak up the remaining $51m. Airforce One, anybody?
Now if you design your advertising to help Google achieve the ideal user experience, you are heading along the right track and probably not helping Google fund that new Airbus. The question is, what is this supposed ideal experience? Think back to when you’ve been googling something and Google, bless its heart, did exactly the right job for you. You found just what you were after, spent a happy few minutes or more splashing about the website Google pointed you to, and didn’t go back to Google until you were ready to search for something else.
And when it fails? That’s when you search, click onto a site, realise it’s not what you’re looking for, quickly click back for another look at the search results, and then click away. Think of it as bouncing between the search results and the sites you find – hunting for that elusive prey.
Advertising that is costly and ineffective will have all the attributes of this scenario – attracting few clicks for the number of times it is shown. What’s more, those who do click bounce off the site in droves – most likely to head back to Google to continue their quest. There’s an Airbus armrest paid for, right there.
Applying poor measurement practices is another armrest – with maybe a seat belt thrown in too. Although you can’t manage what you can’t measure, it’s still common to see people buying Google Advertising with no way to determine what value they gained from it.
It’s easy to see why. Setting up a Google Adwords account is easy peasy – all you need is 20 minutes and a credit card. Just follow the prompts Google provides and your ads will be online, with money being sucked from your account, in mere moments.
Now compare that with the effort required to set up and configure your Google Analytics account. Yes you can get the code in minutes – then someone needs to add it to EVERY page of your website. What’s more, the account needs configuring to track the actions (think sales or contact form requests) that you want your advertising to drive. All going well, and with someone who knows exactly what they need, this work can done in under an hour. But ask the business owner to take on the task and it could be weeks before a web developer has done their job, leaving the marketing assistant to figure out exactly what part of Google Analytics needs customising for the goals to work properly.
So think yourself lucky if your goal tracking is working as it should, allowing you to see exactly how much each lead from your paid advertising channels is costing you. You may also notice that each month the per lead cost moves gradually northwards.
Why is that? Well, Google is the place to be for you AND your competitors. And that drives the bid price up – and with it your cost per lead. Which leaves me with the last part of this presentation summary – nurturing your leads with the care and attention they deserve.
Let’s think about the polar opposite way this could work: Aging sticky notes on computer screens containing the details of prospects who called in for help last week and still haven’t been called back yet.
Then, when they are called back, it’s from salespeople who treat them depending on how they feel that particular day. No method to track who has said what to whom. Appointments get set and people fail to turn up. Quotes are given but never followed up. And so on, and so on.
I know this happens because – as I’m sure you have – I’ve been on the receiving end of nearly all these behaviours. And while businesses can survive in the short term with systems like this, I predict they will soon find themselves priced out of online advertising because their effective cost per sale from online leads will be too high. The smart people who see selling as a “system” will bid up their advertising to grab as much traffic as they can.
Customers will have received a recording of this full presentation. If you are interested in working with us then give us a call or complete a contact request here and let’s start.
So who is on your website NOW? No need to guess – just head over to this report and all will be revealed. This is a great way to while away a few moments and look transfixed as people arrive and wander amongst your pages.
Some of the cool ways to use a report like this would be:
To validate that your tracking is working properly. Today I opened this report and picked up that a client’s mobile website wasn’t being tracked at all. I just opened up my smartphone, turned on my mobile data connection, browsed to their homepage and waited for me to turn up. I didnt.
Sit back and skite about how well your radio advertising worked as you “see” hundreds of new direct visitors arrive in abundance just minutes after your ad ran.
Double check that your Goal Tracking or Event Tracking is correctly configured. Just turn off any filters that could ignore your traffic (if, for example, you were on your work network) and then go ahead and register or complete a sale and see that the necessary Google Analytics goals are working.
Or sit back and while away the Friday afternoon as people take in all your great content.
Enjoy.
“No thanks I’m just looking.”
How many times have you said this when wandering around the shops of your favourite shopping mall? You were probably not alone. Walk around any mall and notice those holding shopping bags compared to those not, and the majority will be looking. Well, it’s the same online.
In fact the web is the first place many go when starting the research stage of any complex purchase. Knowing this, the savvy service marketer knows she needs to create a clever system to a) attract those who are just looking; and then b) nurture them gently but purposefully towards the sale. The key parts that make up this system are the subject of this article.
There are five main stages to follow when creating a “looking-to-buy” nurturing system. Let’s go through each of these in the sequence that I see them deployed.
#1 Converting Anonymous Lookers into Known Lookers
Lookers are reasonably useless in their anonymous state. Somehow you need to stop those “just looking” and convince them to raise their hand and identify themselves. Until they do this all bets are off. There’s very little you can do to nurture them.
Now I realise you can unleash some re-marketing smarts and try to promote yourself to them as they browse other sites. That’s a step further forward than doing nothing. Nevertheless, you really need their email address to start to move ahead.
Content that makes the anonymous known is the magic ingredient behind content marketing. Producing the right content and delivering it in a way that makes someone willing to give up their anonymity (ie, give you their email address) is is not easy. You will trip up along the way as you fine tune your content to make it persuasive enough make the conversion work.
Because you can’t go any further forward until this part is working, stick at it. And once these “just looking” email address leads start to arrive, it’s time to ….
#2 House them in a system that tracks what has been said to whom
You will need a CRM of sorts to hold all these new prospects, remembering that they are not ready to buy just yet. So they don’t need a salesperson calling them to take the order. Instead, they need to receive small pieces of content that slowly, but gradually, move them through the decision making process.
Life is so much easier if the system that houses leads also keeps track of what communication was sent to whom and when. Ideally, it will manage both digital and non-digital channels. So if someone receives a few emails, a direct mail piece and perhaps a check-in call from a call centre, then each and every communication is captured against the prospect’s record.
Once you have a system ready to house and monitor prospects, you can focus on what to say to them and when. Or to stage 3 where you get started on….
#3 Crafting messages that move them further along the buying process
I’m not thinking here of “are you ready to buy now?” reworked multiple ways but all with same intent.
Nope, the plan is to deliver answers to the questions people have as they work through the buying process. Questions like “who else has used your service to solve the same problems I am facing?” or “how do I compare you with others?” or even “why should I consider the premium service when the standard may do the job?”
Customer testimonials, buyer guides and product infographics could deliver answers to questions like these.
Every service business will need to answer its own set of prospect questions. Start by identifying what the common questions are and crafting initial content to answer them.
Then, once you start matching your content to your prospect audience you can begin to….
#4 Take notice of those who take notice
Once again, ideally this will be a feature of your CRM system. Here your leads are stored and your campaigns crafted. And all going well, the system will track emails that are opened, the links clicked inside them, and perhaps even the website pages browsed. All this interaction will then be neatly stored against each prospect record.
Then it will be a simple case of sorting your leads by those who interacted the most with your digital content. The more they open, click and browse, the more likely they are to be ready for the next step where you….
#5 Give people a chance to raise their hand
Those engaging most with your content could require a carefully scripted phone call from a “gently gently” salesperson. Or, if this is too much, perhaps a visit to a group event hosted at your company. Something that moves them off the digital channel into the physical space where the sale can be completed. Nurturing content that has done its job well will make this “bridging content” part of a natural next step.
There you go – my five steps to convert “those looking” to “those buying”. Yes, I admit they are very high level overviews BUT they should give you a starting template to work towards. GIve us a call today if you want help installing them into your online marketing box of tricks.
Don’t get fooled by the techie sounding name – this is a report that delivers on quite a simple need.
Let’s say you ran a marketing PR campaign that delivered 2000 visitors to your website last Monday. Fresh from reading about in you in the newspaper they came a-visiting and did stuff. Some fortunate souls would have become a lead, others perhaps bought something, and the rest meandered in and then left hopefully a lot wiser.
So what do they do next week? Or the week after? Did they just arrive for the day and never come back again or did that PR do a great job and warm them up enough to entice them to return later and turn into great customers? This report helps you answer that question.
A cohort is a group of people defined by the date they arrived at your website. Cohort Analysis allows you to see how they perform after their arrival date based on criteria like website engagement, goal completions or session duration. You can view their performance individually, as a group and also in comparison with others in the group.
Handy stuff.
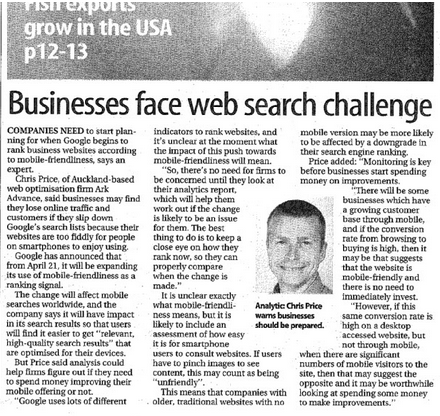
Back in February Google released a note explaining that come April 21 they would take the mobile friendliness of websites as a “ranking factor”. Then in March the Sunday Star Times interviewed me on the subject. As you can imagine, I had definite opinions that I was happy to share!
So what does it all mean?
Based on emails from Google warning customers with non-mobile websites of the upcoming change, it definitely means something. But exactly what, nobody’s yet sure. We’ll be watching the keyword rank reports of our clients with keen interest to see what turns out.
For e-commerce clients in particular, buying a new mobile friendly website is a big ask. So our early advice is to take a wait-and-see approach by monitoring the amount of mobile traffic you receive and its growth curve.
If the initial percentage is low – lets say below 15% – and the growth curve is relatively flat, then your upgrade path could be a way off if – and this is the big IF – your search term rankings don’t tank in the meantime.
However, if your percentage is 35% plus, and the growth curve is steep, and your conversion rates begin to suffer for traffic hitting your non mobile website, then you might want to bite the bullet and make the upgrade.
More on this as it develops.
We’ve all read those articles on what to do to achieve unbounded success online. Well this time I thought I would go with the opposite view. What to do when it’s not going well. Maybe the order book is looking a bit light. Or you start the week with a calendar full of white space without a prospect appointment in sight.
This is the time for quick results and a solid return on any marketing investment. When prospects call us at this stage we know we have to apply proven tactics that work quickly to turn things around. All while delivering the greatest return on their money. No pressure, eh?
Here I outline five of the many tactics we apply, and why each has made the list. Note that the order in which you apply these tactics is important. If you skip one or apply a few out of sequence, our experience is that the overall result is doubtful.
So let’s get started.
Strategy #1 – Clean up your traffic
In its current form and given its current content, your website will need a certain type of traffic to make it work – that is, convert visitors into leads.
Let me explain the “current form” part a bit more. We all know that in deciding which pages to rank over others one of Google’s key criteria is page content. (If you’re not convinced, reading their guide to “Search Engine Optimisation” will remove all doubt.)
This principle also applies to your website’s ability to convert visitors into leads. Content matters. A lot. Your content will hopefully convert a certain type of visitor – perhaps not all of them, but certainly those who like what you have written.
So the task remains to find this group, show it your content, and hope they convert. And because it’s always easier to fix one thing at a time we surmise that the
content will do its job, IF we can find the right audience.
Therefore we need to “clean up” your traffic to locate this group. I define “dirty traffic” as website visitors about whom you have no idea why they came visiting. The non-paid part of the Google search engine – commonly called organic traffic – could contain these people. Google’s no help here because it doesn’t reveal the keyword search terms these visitors used to arrive at your site – so you have no idea what they were looking for. What’s more, some struggling websites struggle to rank for the terms their prospects use.
So the only reliable way forward is to buy traffic using Google AdWords for the keywords you think your prospects will use.
That’s the easy bit. Making your money deliver a really clean group of visitors is a lot harder. Fortunately, you don’t need to test hundreds of keywords at the outset – you can just start with a few.
Then, once you have tapped into some “clean” traffic, you need to decide where to send them. Which brings me to Strategy 2.
Strategy #2 – Master your first impression
So the prospect sees your ad, clicks, and is best sent where?
Anywhere but your Contact Us page. Last month we completed a website re
view for a new client and discovered that their web optimisation company had been sending all their paid advertising traffic to that page.
The client supplied a $10,000 minimum home furnishings service for the renovation market. Their website contained pages and pages of great pictures showcasing their work. But those pictures remained hidden from their paid traffic – and 85% promptly left without looking any further.
Strategy #3 – Cover all the content bases
Once you’re sending your search traffic to the right page, you need to ensure it includes the right content. Take our home furnishings client above. Their visitors clearly expect to see lovely pictures of homes that have benefitted from their service.
Don’t skimp here. Provide lots of content. Make the pictures great – poor photography hurts your brand.
Once you have included the “must have” content, add content that shows your point of difference. For instance, you may be a design agency that crafts solutions specifically for the professional services market. Or an architect who only works on build projects on Waiheke for over $5 million. Or a lawyer who works on divorce cases for professional males between 40 and 55 years old.
Our home furnishings client had a great reputation backed up by lots of testimonials. Also, their sales process was low pressure and delivered by experts. Finally, they were experts in producing custom solutions that their competitors found too hard.
Presenting this “differentiation” content can take your prospects of success to a new high. In fact, the only thing that could hold you back is not applying Strategy 4.
Strategy #4 – Ask for the “Goldilocks Commitment”
The classic sales mistake is to either ask your visitor to to commit to too much too early, or fail to ask for an
y commit at all.
Let’s go back to home furnishings. Pointing visitors at the Contact Us page was definitely asking for too much commitment too early.
But when you looked through their gallery of photos, the opposite mistake was being made. There was no reference to their smart showroom or how to book an appointment with their sales team.
Presenting the right commitment choices to your audience at the right time is an art. It’s one we’ve been practising for over 10 years now, so we know what works and what doesn’t. Sometimes, it takes two or three visits to achieve a commitment from a web visitor. Therefore, you need to…
Strategy #5 – Play the long game
Thankfully, there are are an array of smart online marketing tools to help you recycle your clean traffic enough times to ensure it converts. Remarketing and email marketing are among them.
Remarketing is an easily set up Google product that lets you “follow” your non-converted website visitors as they browse the web, presenting targeted banner ads to them. You’ll need a range of banner sizes to display and someone to help you build your target audience. You can also choose the frequency at which your banner ads are seen, allowing you to hit the sweet spot between visibility and annoyance.
Email marketing is the stalwart of online marketing. It’s been going so long that many forget the reason for its longevity – it works. The main challenge is providing content that the customer deems worthy of giving you their email address. Every year the bar is raised higher.
So there you go – my five strategies to fix a failing service marketing solution. We have seen clients use these steps to transform a system that hasn’t delivered a lead in 10 months to one that delivers every month.
Call us for more information, or if you’d like help applying these steps to your business.
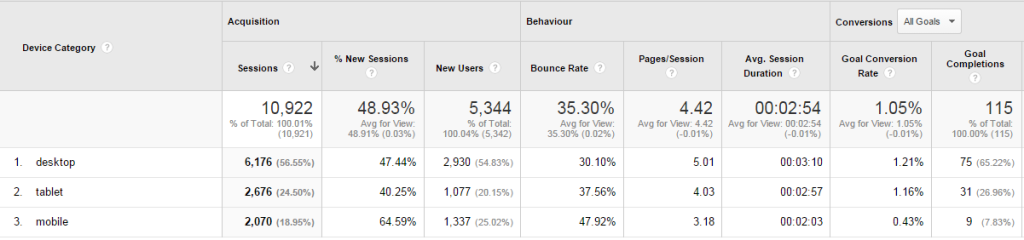
This report splits your traffic based on three device types – desktop, mobile and tablet. It then shows how your website interacts with each of the three across your measures for:
– core engagement (how many visitors you have to the site via each device)
– conversion tracking metrics (how many visits become sales)
It’s important to track these trends over time, so pick a date range that extends 6 or 12 months – especially for your mobile results.
 Visit any cafe and notice especially patrons who are on their own. A fair proportion will have their heads bowed, peering into their screens. Even couples do the same – no time for conversation – nope there’s stuff to be checked online that’s more important than their face-to-face relationship. So this is the report that shows you whether they are looking at your website while they sup their soy latte.
What kind of results can you expect to see? You may be surprised by a recent uptick in mobile traffic. Then you’ll wonder why their engagement is relatively low. Possibly they’re struggling to operate your desktop-centric website through their teeny tiny screens. Perhaps now is the time to look for a layout that plays well across all formats. The things we usually see in this report are:
– Mobile growth curves that have gone all steep on you over the last three months
– Lots of mobile visitors, good engagement but very few mobile conversions
– Unsustainable cost per lead values from mobile Google advertising sending traffic to a non-mobile website
– The percentage of desktop traffic a website is experiencing – sometimes as low as 20%. (Perhaps time for an app?)
Unfortunately it takes more than a few weeks to deliver a fully featured mobile website. Use this report to help get the timing right. So when all is finished you have a good chunk of tiny screen viewers ready to engage with.
And for those with more mobile and tablet traffic than desktop, perhaps it’s time to set up some Google Analytics dashboards – to pick out this traffic source and display how it engages in easy-to-read charts for your monthly reports.
Give us a call today if you would like more details on how this could work.