Originally published October 2013. Fully rewritten April 2026 to reflect GA4, modern tracking, and how conversion attribution actually works today.
Most businesses have Google Analytics installed and barely use it. The problem isn’t a lack of data. It’s a lack of focus. This post walks through a simple way to decide what your analytics should actually track, using the same thinking whether you run a lead-generation site or an ecommerce store.
GA4 has a lot of reports. I haven’t counted them recently, but the sub-menus still run deep enough that starting at the top and clicking through is a reliable way to lose an afternoon and learn nothing useful.
Searching “what GA4 reports should I be looking at?” doesn’t help much either. You get generic advice that might be right for somebody else’s business. Not necessarily yours.
So how do you decide what to pay attention to? I’ve found the same approach that worked a decade ago still works now, even with GA4’s different structure. Start by writing down what a successful visitor journey on your website actually looks like. Then work backwards and set up measurement that proves each step happened.
I call this the “analytics net”: the set of reports and tracking that sits around your ideal customer journey and tells you where people fell through and where they made it all the way.
Two examples below, one for service businesses and one for ecommerce.
Example 1: A service business generating leads
The journey
Someone in Auckland searches for what we do. They land on our website from either our organic ranking or a Google Ads click. They read a couple of pages for 2-3 minutes. They fill in our quote request form, or they pick up the phone. The enquiry reaches our team, and someone contacts them the next business day. If the call goes well, they become a client.

The analytics net
Google Search Console tells us whether our site ranks for searches that matter, and whether people who see us rank actually click. If impressions are high but clicks are low, the page title and meta description are doing the ranking but not doing the selling.
Google Ads linked to GA4 lets us separate paid traffic from organic, so we can tell which keywords and which campaigns are actually driving our enquiries rather than just driving clicks.
Engagement metrics in GA4 tell us what people do after they arrive. Engagement rate, average engagement time, pages per session. If visitors from one source are bouncing quickly and visitors from another source are reading three pages before filling in the form, that’s worth knowing.
Key events in GA4 (the new name for conversions) tell us how often the form was actually submitted. We can break that down by source, campaign, landing page, device, and most other dimensions. A goal completion in the old Google Analytics became a “key event” in GA4. Same idea, different wiring.
Call tracking is the piece most businesses skip, and it’s the one I’d add first. If people also pick up the phone from your website, you want to count those calls the same way you count form fills. Otherwise you’re only measuring half your conversions. A decent call tracking setup records each call against the traffic source that brought the visitor to the site, so you can see how calls from Google Ads compare with calls from organic search.
A CRM, or even a simple spreadsheet, closes the loop. Of the enquiries you received, which actually turned into clients? A form fill is a useful proxy, but the number that matters is clients. This step is boring. It’s also the difference between guessing at your marketing and knowing.
Example 2: An ecommerce store
The journey
Someone searches for a product we sell. They click through from organic, Google Ads, or Shopping results and land on the product page. They browse for a couple of minutes, then either buy now, abandon, or come back later from one of our remarketing or email campaigns and buy then. Once they’ve bought, they get added to our email list. The good email subscribers buy again. The great ones buy several times a year.
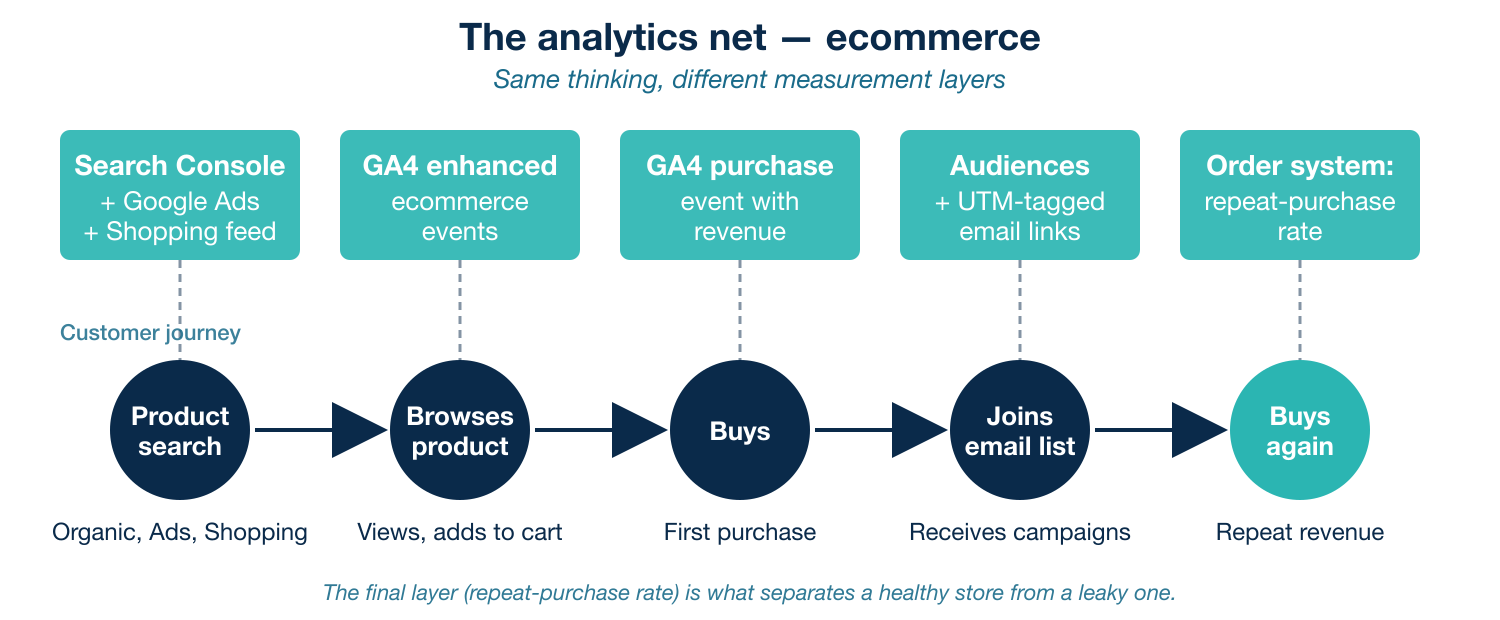
The analytics net
Search Console and Google Ads do the same work as before. They tell us which searches and campaigns are driving the right kind of traffic to our product pages.
GA4 enhanced ecommerce tracking measures the whole funnel: product views, add-to-carts, begin-checkout, and completed purchases, with revenue attached. This is where GA4 is genuinely better than Universal Analytics ever was. The event-based model handles checkout journeys more cleanly than the old session-based setup.
Audiences in GA4 let us split traffic into meaningful groups like purchasers vs non-purchasers, first-time buyers vs repeat buyers, or email subscribers vs everyone else. Once you can see the difference in behaviour between these groups, the reports start telling a story.
UTM tagging on email campaigns makes sure the traffic from an email click comes through as “email”, not as “direct” or bundled in with organic. Without UTM tags, email marketing looks invisible in GA4 and that’s an easy way for a channel to get underfunded.
Cross-platform attribution matters more than it used to. People rarely buy on the first visit. They see a product, think about it, come back via a different channel, and buy later. GA4’s attribution reports help with this, though they’re not perfect. For the clearest view, bring your ecommerce platform’s own data alongside the GA4 data and reconcile them.
A repeat-purchase rate from your ordering system is the equivalent of the CRM step in the first example. Are your email subscribers buying more often than people who never signed up? If yes, the email programme is earning its keep. If not, something’s off.
It’s the same thinking either way
Both examples start with a sentence describing the ideal customer journey. Both end with a measurement setup that can prove whether that journey is happening and where people are dropping off.
The details change depending on the business. The thinking doesn’t.
Most people open GA4 looking for reports to interpret. The reports only make sense if you know what you’re looking for first. Write down what a successful visit to your website looks like, then build a setup that proves it happened. The rest of the reports can stay closed.
If you’d like help turning your website journey into an analytics setup that actually proves what’s working, take a look at our Google Analytics consulting service. That’s the kind of work we do.