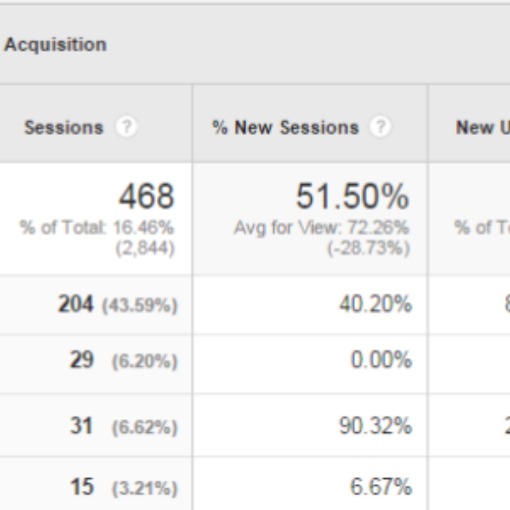
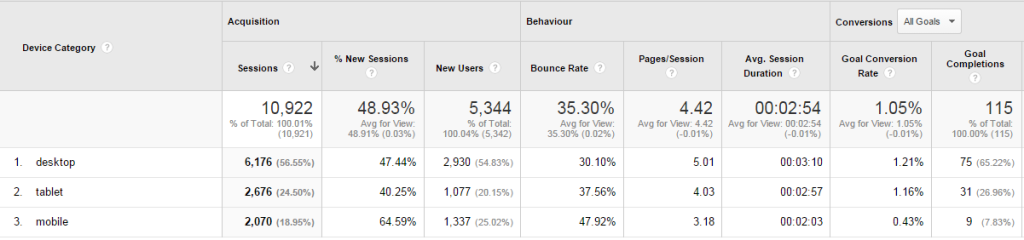
This report splits your traffic based on three device types – desktop, mobile and tablet. It then shows how your website interacts with each of the three across your measures for:
– core engagement (how many visitors you have to the site via each device)
– conversion tracking metrics (how many visits become sales)
It’s important to track these trends over time, so pick a date range that extends 6 or 12 months – especially for your mobile results.
 Visit any cafe and notice especially patrons who are on their own. A fair proportion will have their heads bowed, peering into their screens. Even couples do the same – no time for conversation – nope there’s stuff to be checked online that’s more important than their face-to-face relationship. So this is the report that shows you whether they are looking at your website while they sup their soy latte.
What kind of results can you expect to see? You may be surprised by a recent uptick in mobile traffic. Then you’ll wonder why their engagement is relatively low. Possibly they’re struggling to operate your desktop-centric website through their teeny tiny screens. Perhaps now is the time to look for a layout that plays well across all formats. The things we usually see in this report are:
– Mobile growth curves that have gone all steep on you over the last three months
– Lots of mobile visitors, good engagement but very few mobile conversions
– Unsustainable cost per lead values from mobile Google advertising sending traffic to a non-mobile website
– The percentage of desktop traffic a website is experiencing – sometimes as low as 20%. (Perhaps time for an app?)
Unfortunately it takes more than a few weeks to deliver a fully featured mobile website. Use this report to help get the timing right. So when all is finished you have a good chunk of tiny screen viewers ready to engage with.
And for those with more mobile and tablet traffic than desktop, perhaps it’s time to set up some Google Analytics dashboards – to pick out this traffic source and display how it engages in easy-to-read charts for your monthly reports.
Give us a call today if you would like more details on how this could work.