
Originally published September 2012. Fully rewritten March 2026 to reflect how Google Analytics works today.
Someone tells you over a beer that their website got 50,000 sessions last month. You know yours shows 3,000 users. Should you be worried? Probably not. Those two numbers are measuring completely different things, and one of them is far more useful than the other.
The metrics that don’t mean what you think
This post originally tackled the difference between “hits” and “unique visitors” back in 2012. Nobody talks about hits anymore (thankfully), but the underlying confusion hasn’t gone away — it’s just wearing different clothes.
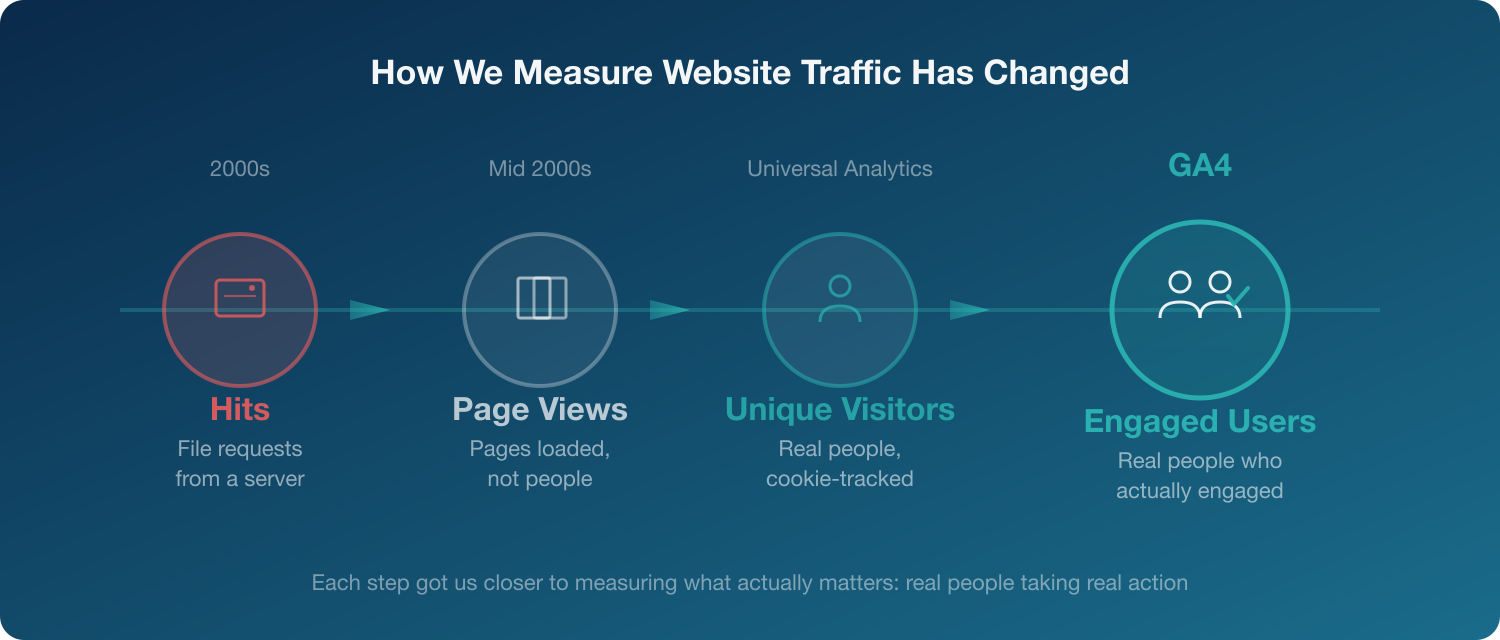
The old progression went like this:
- Hits counted every file request from a server. A page with 20 images counted as 21 hits. Completely meaningless for understanding traffic, but people loved quoting big numbers.
- Page views were better, but still just a count of pages loaded. Someone refreshing a page ten times looked the same as ten different people.
- Unique visitors finally gave us a count of actual humans. Google Analytics (the old Universal Analytics version) set a cookie on each browser and tracked individual people.
That last metric was the gold standard for years. But when Google replaced Universal Analytics with GA4 in 2023, the way we count people changed significantly.
How GA4 counts people now
GA4 introduced a different set of core metrics, and the terminology shift trips up a lot of people. These are the ones worth understanding:
Users. The total number of distinct people who visited your site. Closest thing to the old “unique visitors” metric. GA4 identifies users through cookies, but also uses machine learning to fill gaps when cookies are missing (which happens increasingly often as browsers tighten privacy controls and visitors decline consent).
Active Users. The primary user metric in most GA4 reports. These are users who had an “engaged session” (more on that below) or triggered a key event. When GA4 shows you a user count, it’s usually active users, not total users. Universal Analytics just counted anyone who showed up.
Sessions. A period of activity on your site. Similar to the old “visits” metric. A session starts when someone arrives and ends after 30 minutes of inactivity. One user can have multiple sessions.
Engaged Sessions. An engaged session is one where the visitor stayed longer than 10 seconds, viewed two or more pages, or triggered a conversion event. It filters out the people who landed, glanced, and left.
Engagement Rate. The percentage of sessions that were engaged. This replaced the old bounce rate as the default metric. A 60% engagement rate means 6 out of 10 visitors actually spent time with your content.
Why this matters for the bar conversation
Back to that beer. Your competitor says 50,000 sessions. You have 3,000 users. These aren’t comparable numbers — sessions and users measure different things. One person visiting five times creates five sessions but remains one user.
The more useful comparison would be engaged sessions or engagement rate. Someone could have 50,000 sessions with a 25% engagement rate (12,500 engaged visits), while your 3,000 users at 70% engagement rate means 2,100 quality visits from people who actually read your content.
Neither number tells the full story without context. But at least we’ve moved beyond counting file requests from a server.
The privacy dimension
One thing that’s changed since 2012: cookie tracking is no longer the reliable backbone it once was. Between browser privacy features (Safari’s Intelligent Tracking Prevention, Firefox’s Enhanced Tracking Protection) and cookie consent requirements, a portion of your visitors are invisible to analytics.
GA4 compensates with modelled data, using machine learning to estimate the behaviour of users who declined cookies based on the patterns of those who accepted. It’s imperfect, but it’s a more honest approach than pretending everyone is trackable.
The practical takeaway: your real traffic is likely higher than GA4 reports. Focus on trends and ratios (like engagement rate) rather than absolute numbers, because the absolute numbers have a margin of error baked in.
What to actually look at
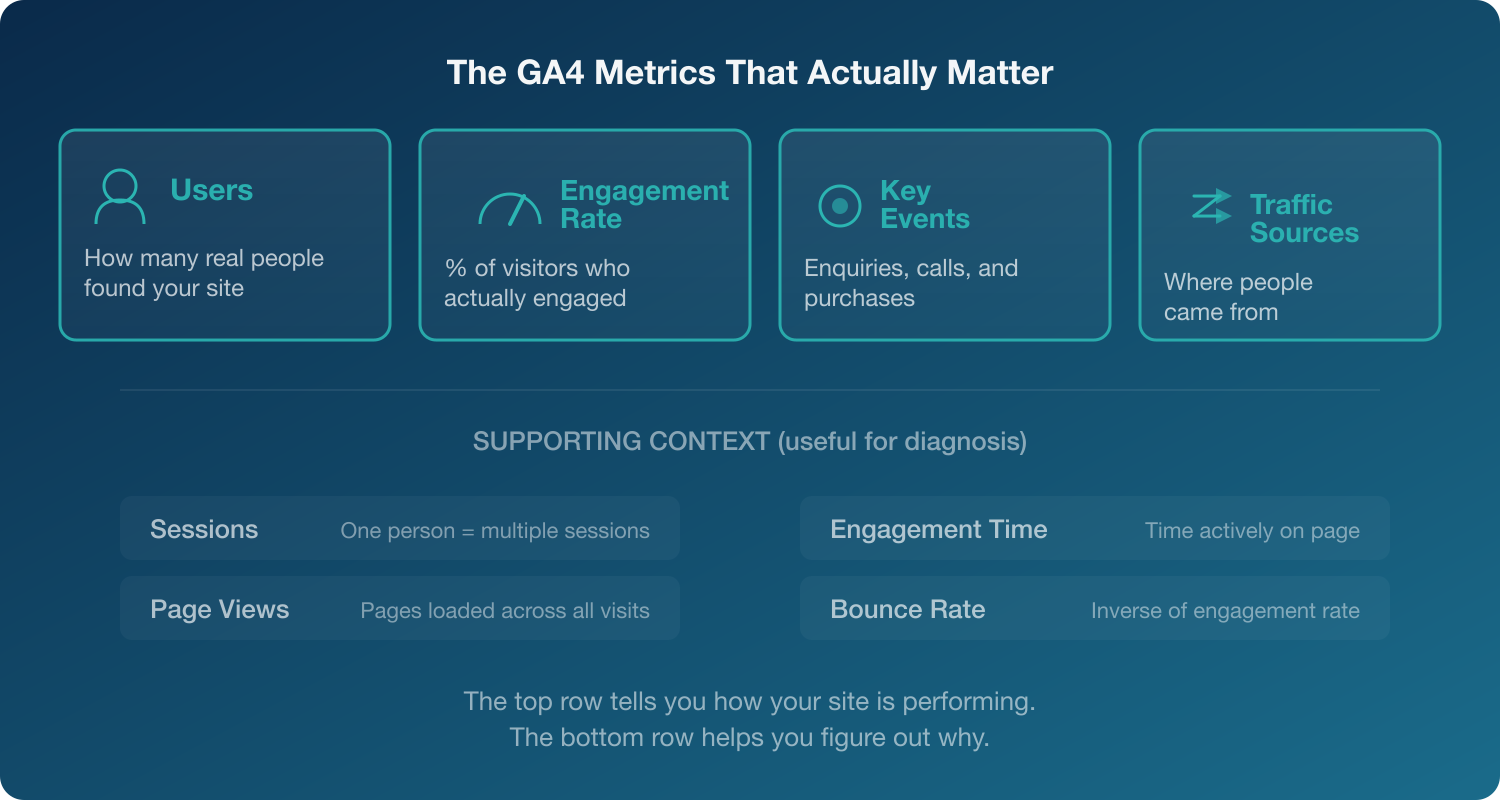
If you’re trying to understand whether your website is performing well, these are the metrics worth tracking:
- Users — how many real people are finding you
- Engagement rate — what proportion of visitors actually engage with your content
- Key events (formerly “conversions”) — how many people did the thing you wanted them to do (enquiry form, phone call, purchase)
- Traffic sources — where those people came from, so you know what’s working
Everything else is context. Sessions, page views, and average engagement time are useful for diagnosis, but they’re not the headline numbers.
So next time someone brags about their traffic numbers, ask them: “How many of those people actually did something?”
If you’d like help making sense of your website data, take a look at our Google Analytics consulting services.